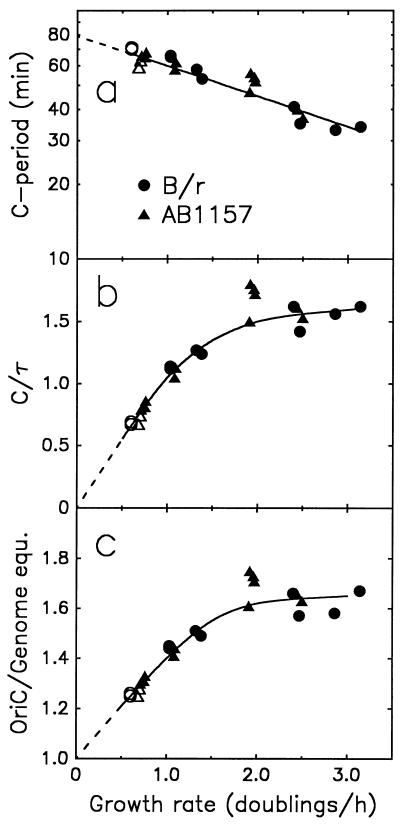
FIG. 3.
Growth rate variation in the velocity of chromosome replication. (a and b) C period (in minutes in panel a; period as a fraction of culture doubling time, τ, in panel b) and (c) number of origins per genome equivalent of DNA are plotted as functions of growth rate for E. coli B/r (circles) and the K-12 strain AB1157 (triangles). The media used were (in the order of increasing growth rate) succinate minimal (open symbols), glycerol minimal, glucose minimal, glucose-amino acids, and LB (solid symbols). Genome equ., genome equivalents.

