Figure 2.

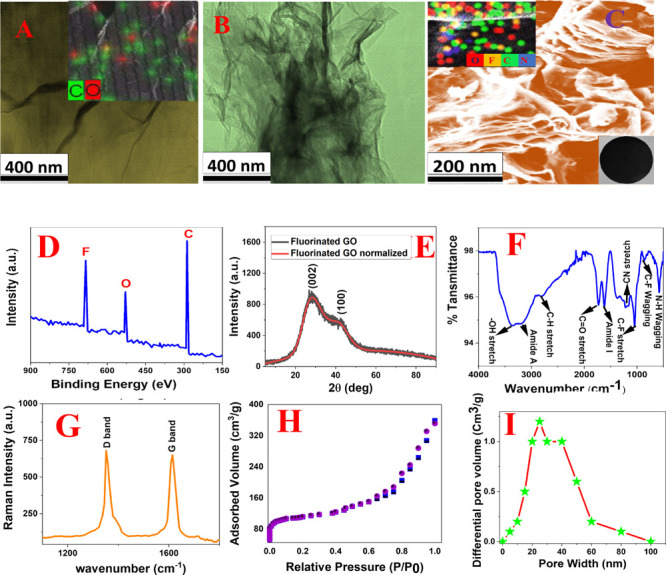
(A) TEM image shows the morphology of 2D graphene oxide. Inserted energy dispersive spectrometry (EDS) mapping shows the presence of C and O in 2D graphene oxide. (B) TEM image shows the morphology of 2D fluorinated graphene oxide. (C) SEM image shows the morphology of the 2D fluorinated graphene oxide and PEI based 3D nanoplatform. Inserted energy dispersive spectrometry (EDS) mapping shows the presence of C, O, N, and F in the 3D nanoplatform. Another inserted image shows the nanoplatform developed using the FGO-PEI based 3D nanoplatform. (D) The XPS spectrum from FGO confirms peaks at 288.5, 533.2, and 688.3 eV, which are due to C, O, and F, respectively. (E) XRD data from FGO show the presence of (002) and (100) reflection peaks. (F) FTIR spectra from the FGO-PEI based 3D nanoplatform shows the presence of −C–F, −C=O, −O–H, amide-I, and amide-A peaks. (G) Raman spectra from the FGO-PEI based nanoplatform shows the presence of D and G peaks. (H) N2 adsorption/desorption isotherm of the FGO-PEI based 3D nanoplatform. (I) Pore size distributions from the FGO-PEI based 3D nanoplatform show that pore size varies from 5 to 100 nm, with the highest pore density being around 30 nm.
