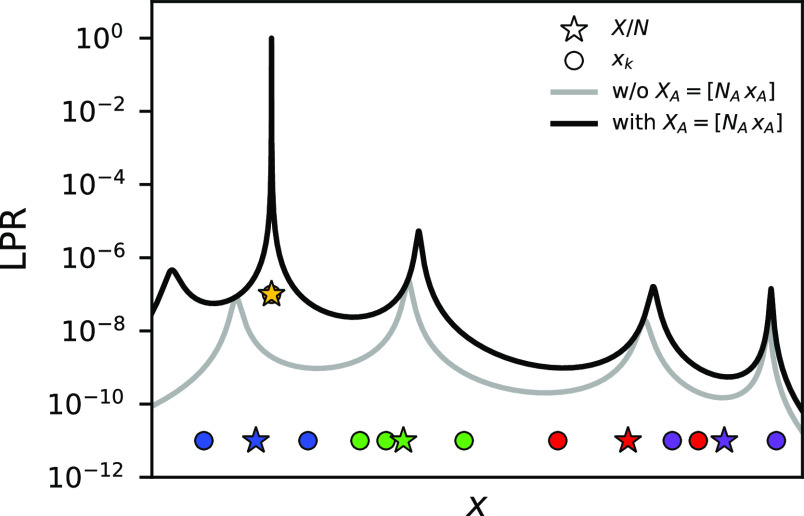
Figure 2.
LPR profiles of a numerical toy model over the entire range of interest for local feature x. Values of xk that appear in the training set are plotted with circles on the bottom, color-coded according to the group to which they contribute. Stars mark X/N of each global data point in the training set, which corresponds to how the global quantity would be predicted. The LPR profiles are shown for the model before (gray) and after (black) inclusion of a group of local features XA = [NAxA] that consists of one local feature xA replicated multiple times, shown in yellow.

