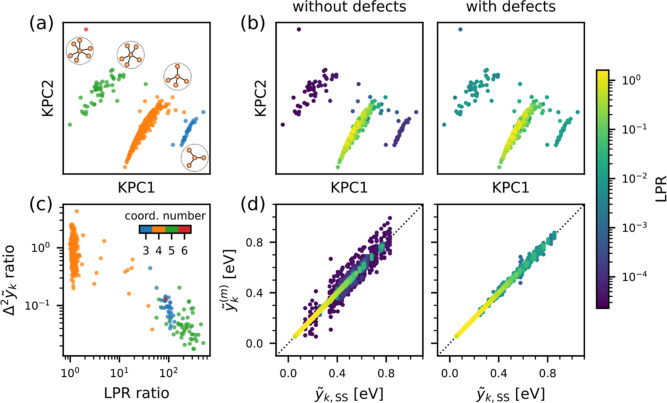
Figure 4.
LPR and local energy predictions of models trained on the amorphous silicon (a-Si) data set before and after the inclusion of structures containing under-/overcoordinated defect environments in the training set. (a) Kernel principal component analysis (KPCA) map with the points color-coded by coordination numbers of the atomic environments. For each cluster of points, a corresponding schematic environment is shown as insets. (b) KPCA map color-coded by the LPR value from each model. (c) Ratio of the variance of the committee-predicted local energies (Δ2ỹk) vs ratio of the LPR, before and after inclusion of the defect-containing structures in the training set. (d) Parity plots of the local energies predicted by a committee of 10 models vs the committee average prediction, where the points are color-coded by the corresponding LPR values. Energy values are reported with respect to the atomic energy of crystalline silicon.

