
Fig 2.
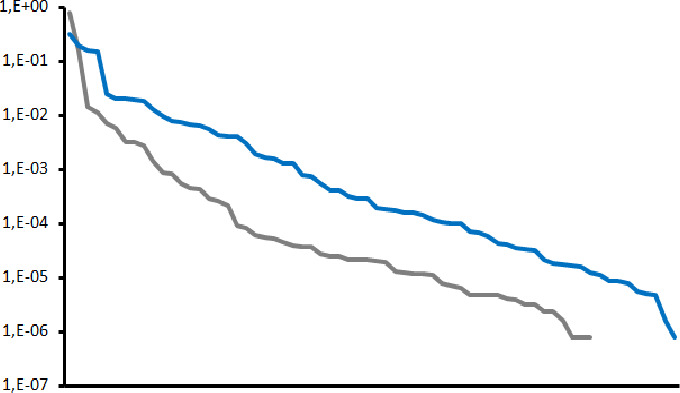
Distribution of percentage of mapped VANA (gray) and dsRNA (blue) reads for each detected virus in the 60-viruses community using a normalized 1.44 million reads sequencing depth. The percentages of mapped reads for each virus are shown on a logarithmic scale, from 1,E + 00 (100%) to 1,E − 07 (0.000001%).