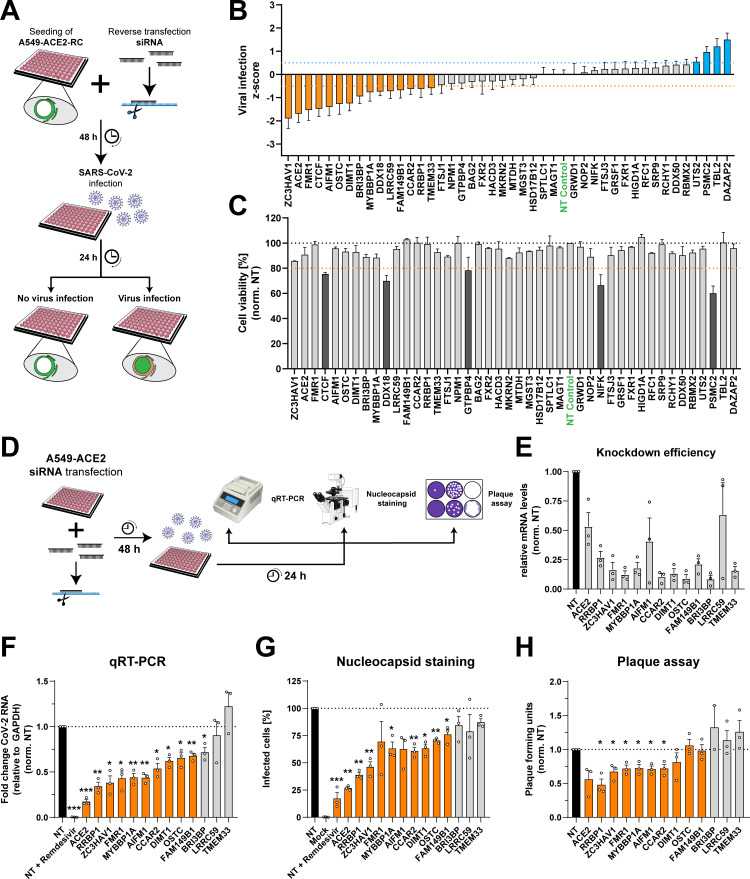
Fig 4.
Functional role of SARS-CoV-2 nsp3/4 interaction partners in the viral replication cycle. (A) Schematic overview of the siRNA-mediated gene silencing approach used for the investigation of the role of SARS-CoV-2 nsp3/4 interaction partners in the viral replication cycle. A549 cells constitutively expressing the virus receptor ACE2 and a reporter construct (A549-ACE2-RC) were seeded into glass-bottom 96-well plates for microscopy analysis and reverse transfected with siRNA pools targeting the identified interaction partners. And 48 hours post-transfection, cells were infected with SARS-CoV-2 (MOI = 5) and, after 24 hours, fixed using formaldehyde. The percentage of infected cells upon knockdown of a given interaction partner was evaluated with a semi-automated image analysis pipeline. (B) Summary of two independent experiments, each performed with technical triplicates. The z-score calculated for the different interaction partners and the controls targeting the virus receptor ACE2 and a non-targeting control siRNA (green) are shown as a mean ± SEM. Cutoffs were set at a mean z-score of ±0.5 (dotted lines), and host dependency and restriction factors are colored in orange and blue, respectively. (C) In parallel to the experiments described in (B), A549-ACE2-RC cells were transfected with siRNAs, the media were exchanged 48 hours post-transfection, and the cell viability was determined at 72 hours post transfection using the CellTiter Glo assay. The reduction of cell viability by gene silencing was considered cytotoxic at values lower than 80% (orange-dotted line). (D) Schematic overview of the host factor validation assays. A549-ACE2 cells were seeded into 24-well plates and transfected with siRNA pools targeting host factors identified by the reporter cell screen. Forty-eight hours later, cells were infected with SARS-CoV-2 (MOI = 5). Also, 24 hours post infection, supernatant was collected for plaque-forming assay, and cells were either fixed in 10% formaldehyde for immunofluorescence assay, or RNA was extracted for qRT-PCR to determine knockdown efficiency (E) or viral RNA levels (F). (G) Quantification of infected cells was performed by immunofluorescence staining of the viral nucleocapsid protein. The percentage of infected cells was normalized to the non-targeting control and plotted. (H) Release of infectious virus particles was measured by plaque-forming assay with serially diluted supernatants harvested 24 hours post infection. Data were normalized to the non-targeting control. Orange bars indicate significant reduction of viral replication in more than two assays. The experiments were performed in biological triplicates, and data were plotted as mean ± SEM. An unpaired t-test was performed to assess statistical differences with *P < 0.05, **P < 0.01, ***P < 0.001.

