
Figure 3.
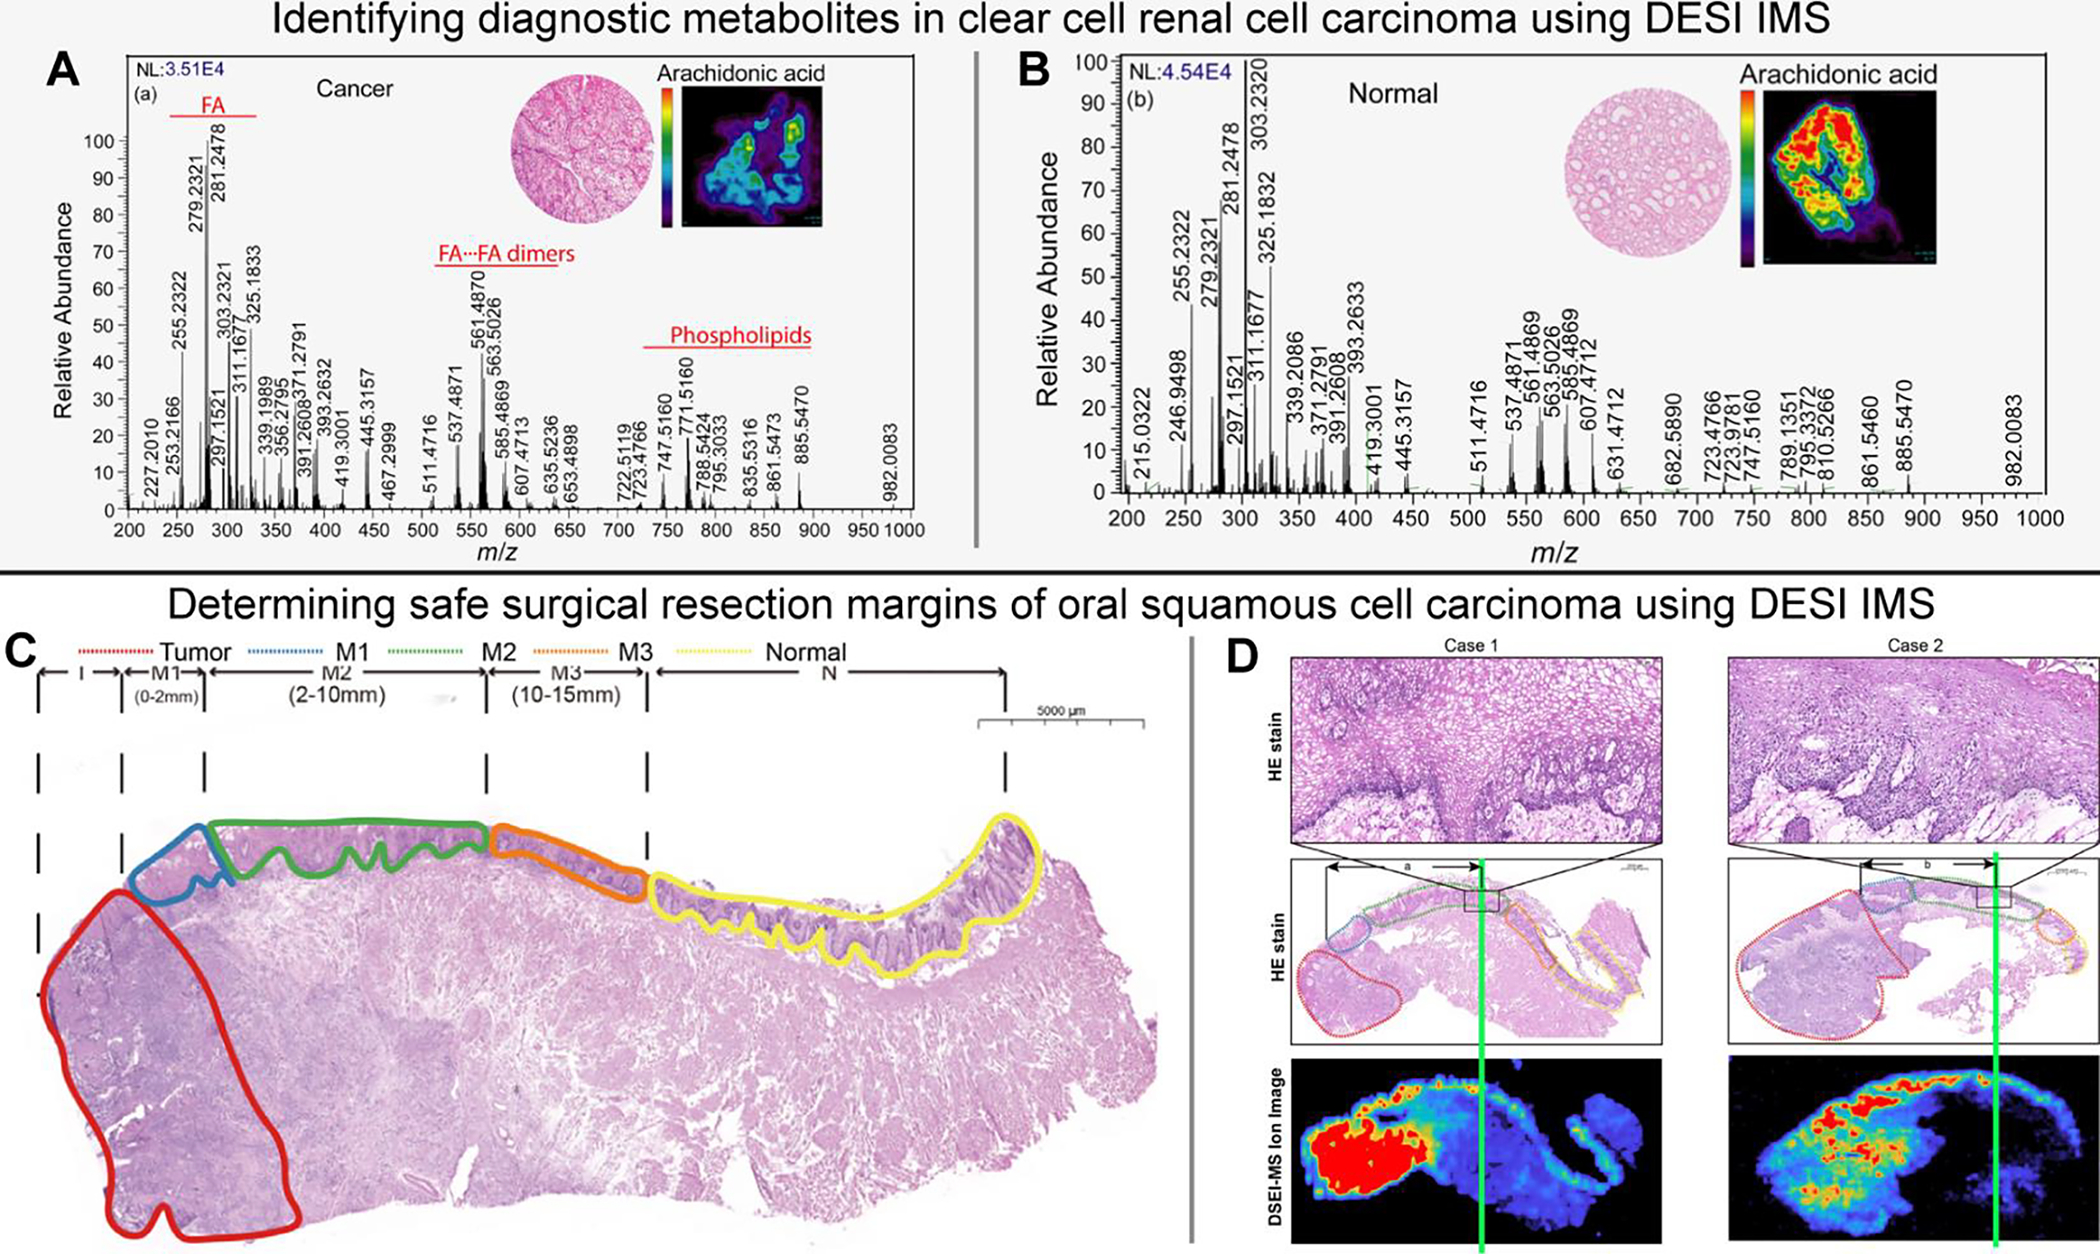
Identifying diagnostic metabolite signatures in clear cell renal cell carcinoma (A-B) [Reference 113] and determining safe surgical resection margins of oral squamous cell carcinoma (C-D) [Reference 114] using DESI IMS. Comparison between average mass spectra of normal (A) and ccRCC tissues (B) (m/z200 –1000), where the inset shows hematoxylin and eosin stains of each as well as ion images of arachidonic acid. Annotated hematoxylin and eosin-stained tissue with oral squamous cell carcinoma including T - Tumor (red), M1- positive margin (blue), M2 - close margin (green), M3 - negative margin (orange), N - normal (yellow) (C). Annotated stains and DESI IMS ion images depicting safe margin distance (green line) as the region where ion intensity decreases/disappears (D). Figures adapted from Vijayalakshmi et al. (2019) [Reference 113] and Yang et al. (2022) [Reference 114] with permissions from the publisher.