
Fig. 1.
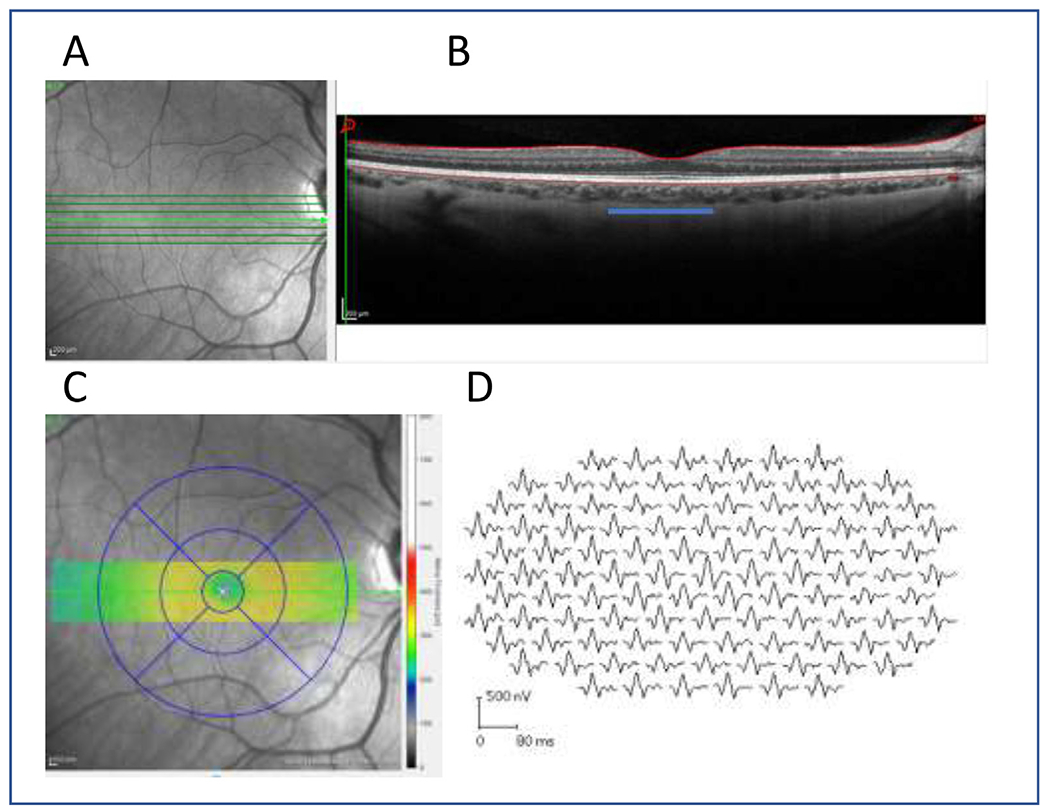
(A) The en face image of retinal area and (B) the central 1mm (3.33 deg) foveal area (blue line) as measured from the 7-line raster and (C) the corresponding foveal area represented by the OCT measure using the ETDRS grid. (D) the mfERG traces from the same subject are also shown. The central waveform was evaluated in this study.