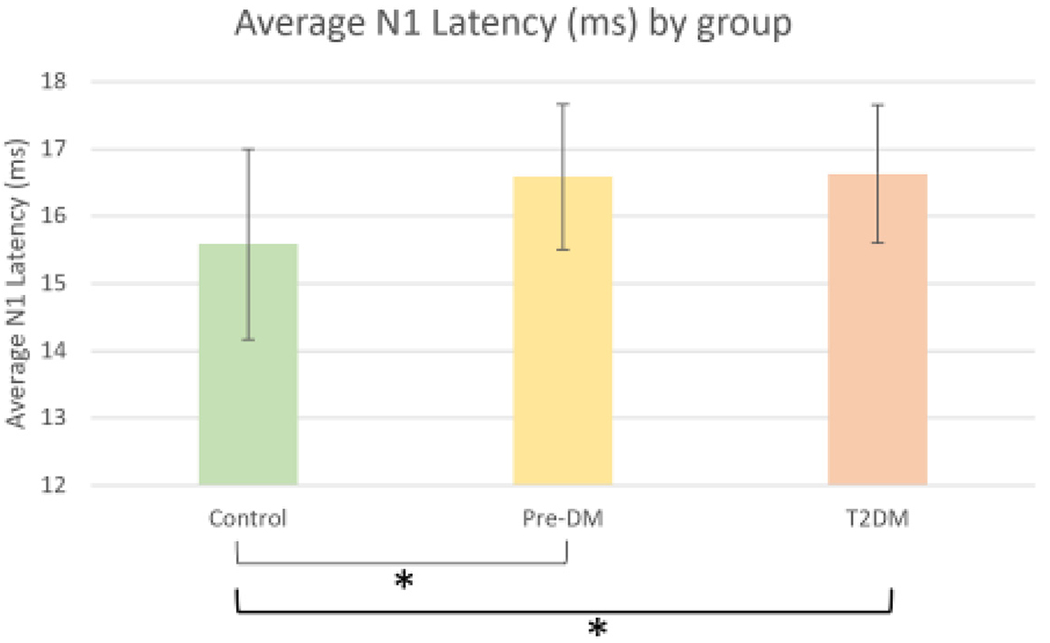
Fig. 2.

Average N1 Latency at the central foveal hexagon for Control, Prediabetes, and Type 2 Diabetes groups. A significant relationship (denoted by *) is present where the N1 latency is longer in the subjects with Diabetes and Prediabetes compared to controls. P<0.001 after controlling for age. Error bars indicated the 95% confidence interval.
