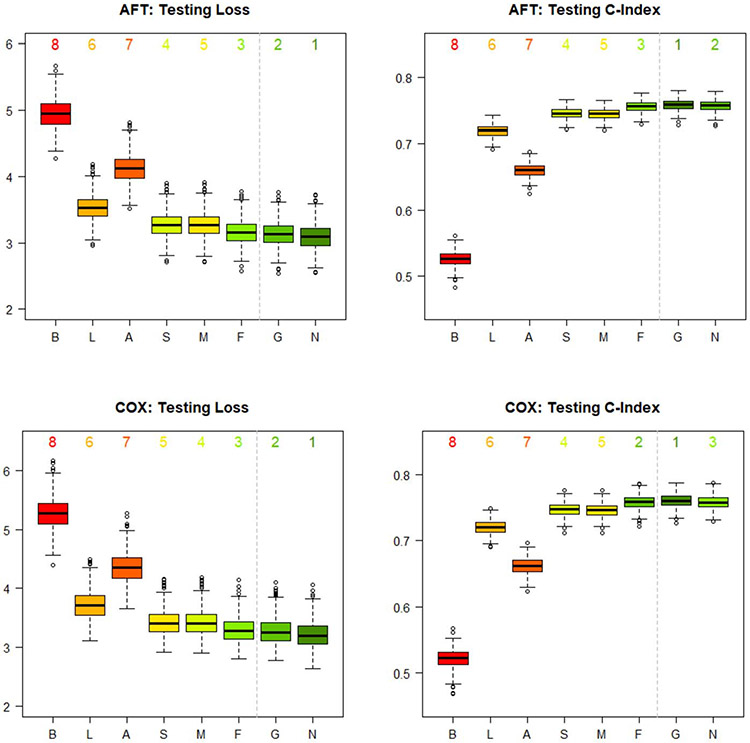
Fig. 6.
Distributions of the 500 testing losses and 500 testing C-indexes for each of the eight dynamic prediction models in the simulation studies. The models resulting in the lowest median testing loss and the highest median testing C-index are labelled 1. The models resulting in the highest median testing loss and the lowest median testing C-index are labelled 8. The six dynamic transformed MRL models are labelled according to their formulation of . “B” represents the baseline vector. “L” represents the last-value carried forward vector. “A” represents the average vector. “S” represents the linear regression vector. “M” represents the mixed effects vector. “F” represents the FPCA vector. Furthermore, “G” represents the LSTM-GLM, and “N” represents the LSTM-NN.

