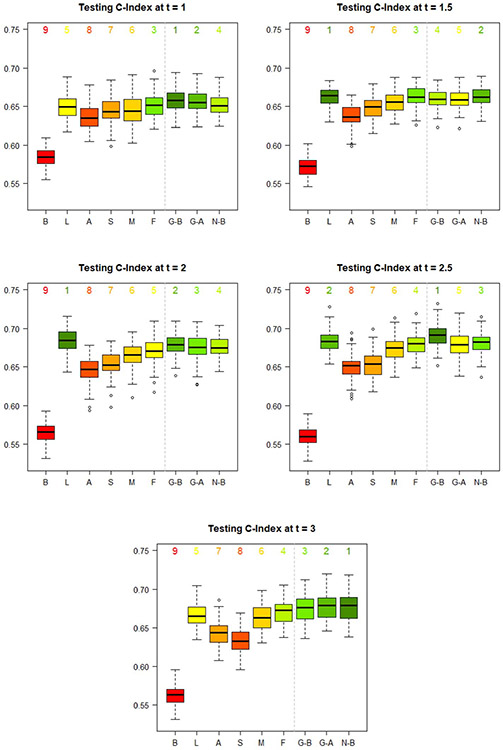
Fig. 9.
Distribution of the 100 testing C-indexes for each of the nine studied dynamic prediction models at each prediction time . The model resulting in the highest median testing C-index is labelled 1. The model resulting in the lowest median testing C-index is labelled 9. The six dynamic transformed MRL models are labelled according to their formulation of . “B” represents the baseline vector. “L” represents the last–value carried forward vector. “A” represents the average vector. “S” represents the linear regression vector. “M” represents the mixed effects vector. “F” represents the FPCA vector. The best LSTM-GLM is labelled “G-B.” The automated LSTM-GLM is labelled “G-A.” The best LSTM-NN is labelled “N-B.”

