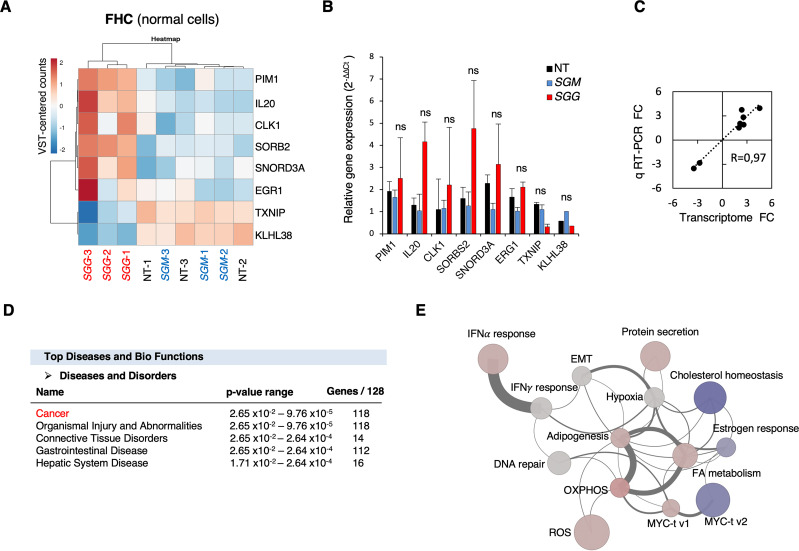
Fig 3. Transcriptional responses of human normal FHC cells upon SGG infection.
A. Heat map of transcriptomic data displaying the top six up-regulated and two down-regulated genes. The heatmap is based on the variance-stabilized transformed (VST) count matrix. Rows and columns have been re-ordered thanks to a hierarchical clustering using the correlation and Euclidean distances respectively and the Ward aggregation criterion. Color scale ranges from -2 to +2 as the rows of the matrix have been centered. B. Relative quantification (2-ΔΔCt) of mRNA levels at 24 h of infection with SGG, SGM or non-treated (NT). C. Correlation of fold changes between transcriptome and quantitative real time PCR for the 8 genes shown in B. D. Top Disease and Bio Functions using Ingenuity Pathway Analysis (IPA) using genes differentially expressed between SGG UCN34 and SGM. Molecules indicate the number of genes associated with indicated diseases and disorders. A right-tailed Fisher’s Exact Test was used to calculate a p-value determining the probability that each biological function and/or disease assigned to that data set is due to chance alone. E. Network representation of the 14 significantly enriched HALLMARK gene sets upon SGG infection on FHC cells. Each node (circle) represents a gene set. Node size is proportional to the number of genes present in the dataset and belonging to the gene set. Node colors reflect the average expression directionality (based on the average of the log fold expression for each gene belonging to the gene set) (red = over expressed; blue = down regulated; grey = no statistically significant difference in expression). The intensity of the color is proportional to the strength of the average expression. Each edge connecting two nodes means that two gene sets share the same genes. The edge width is proportional to the number of genes shared among the two gene sets. Edges are shown only if at least two genes are shared among the two gene sets (30 edges).

