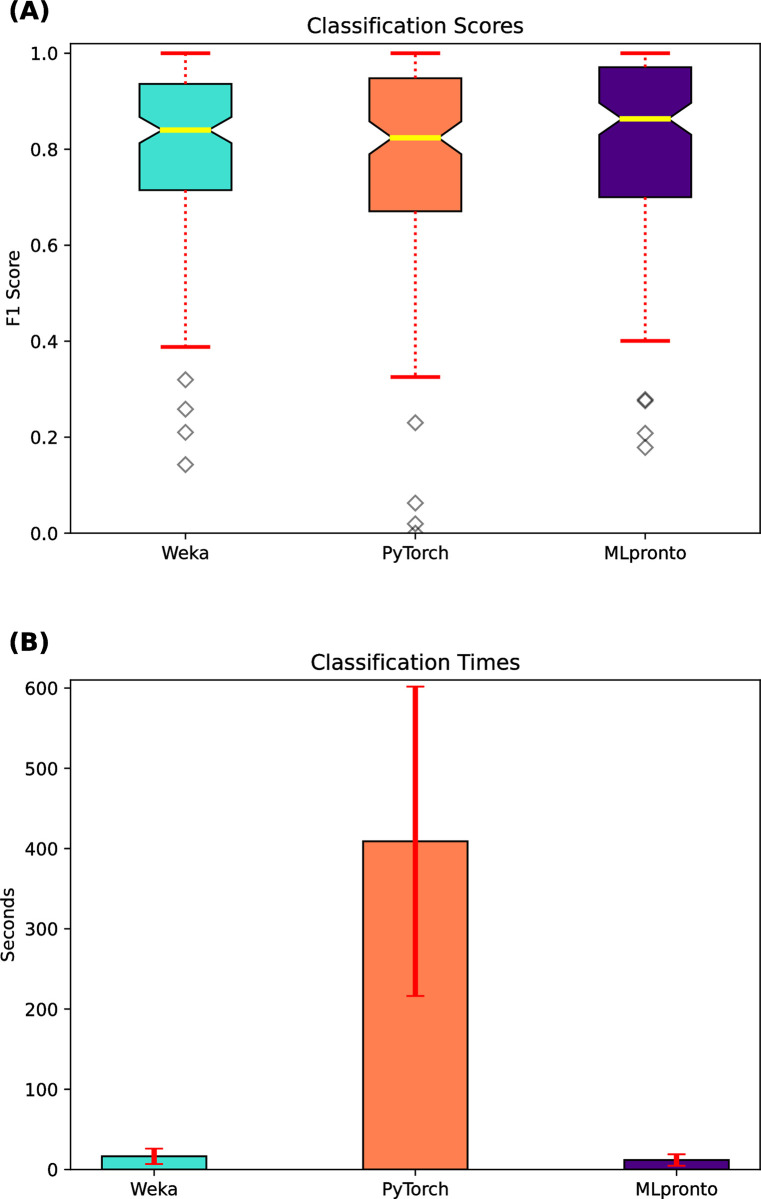
Fig 2. Classification performance of single-model tools.
On 165 classification datasets, results are shown when executing three single-model tools, Weka, PyTorch, and MLpronto. (A) The box and whisker plot illustrates the performance of the tools as measured by F1 score. The horizontal line (yellow) indicates the median F1 score across the 165 classification datasets. The top and bottom of the box indicate the 25th percentile and the 75th percentile, respectively. The notches in a box represent the confidence interval around the median. The whiskers (red) extend from the box by 1.5 times the inter-quartile range. Outlier (flier) points are indicated as diamonds (gray). (B) The bar plot illustrates the mean runtime of training for each tool on the 165 classification datasets. Error bars (red) correspond to standard error.

