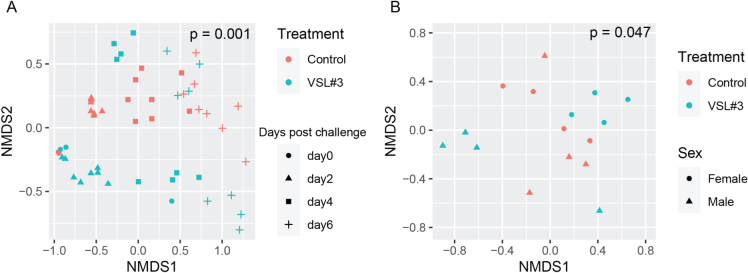
Figure 5.
Beta-diversity in fecal and cecal microbiota measured over time. Using unsupervised clustering, NMDS illustrates the dissimilarity indices via Bray-Curtis distances between the bacterial communities from feces on days 0, 2, 4, and 6 post challenge (A) and from ceca on day 7 post challenge (B) (n = 4-8 mice per treatment group). NMDS: Non-metric multidimensional scaling.

