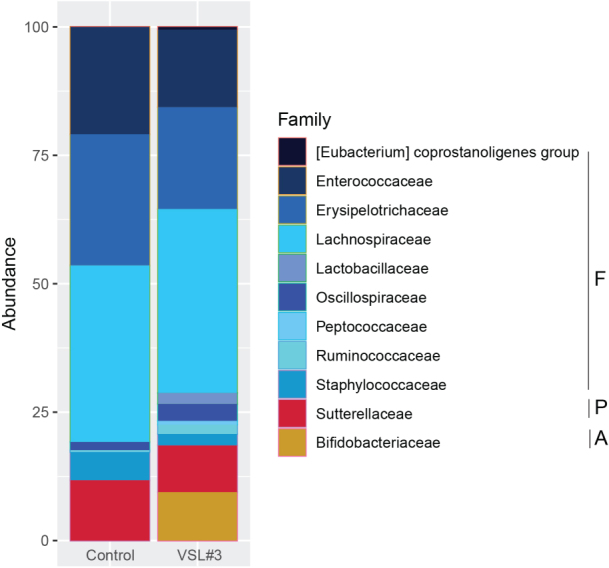
Figure 7.

Impact of VSL#3® on cecal bacterial community membership on days 7 post challenge. Bar plots depict the mean percent abundances of the top bacterial families sorted by phylum where F - Firmicutes, P - Proteobacteria, B - Bacteroidetes, and A - Actinobacteria (n = 4-8 mice per treatment group).
