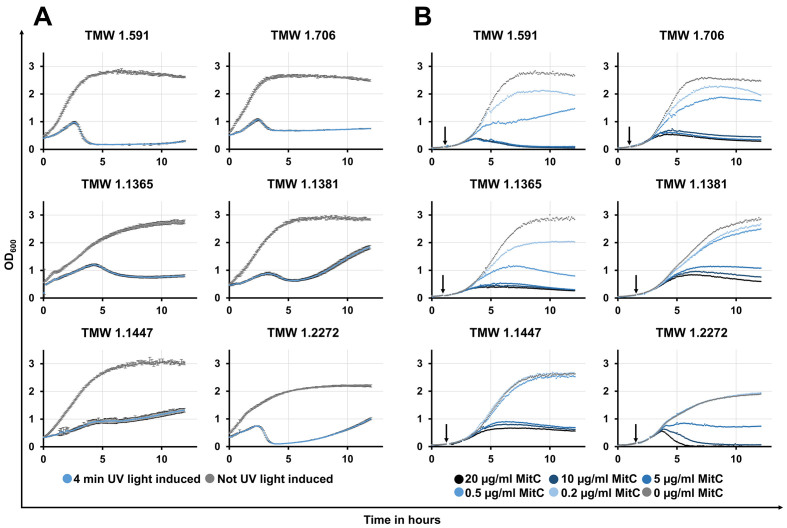
Figure 3.
Growth curves of lysogenic L. curvatus strains after induction via UV light (A) or mitomycin C (B) treatment and without such treatment. Optical density was measured at 600 nm (OD600) (Y-axis; scale: 0-3.5) over the time (X-axis; scale 0-13) in hours (h). For the induction in (A), 4-min UV light exposure was used (no UV light exposure for control); For the induction in (B), different mitomycin C concentrations (20 µg/mL, 10 µg/mL, 5 µg/mL, 0.5 µg/mL, 0.2 µg/mL, and 0 µg/mL as control) were used. In (A), induction was performed directly before the measurement was started; In (B), the addition of mitomycin C to the bacterial cultures is indicated by an arrow. L. curvatus: Latilactobacillus curvatus.

