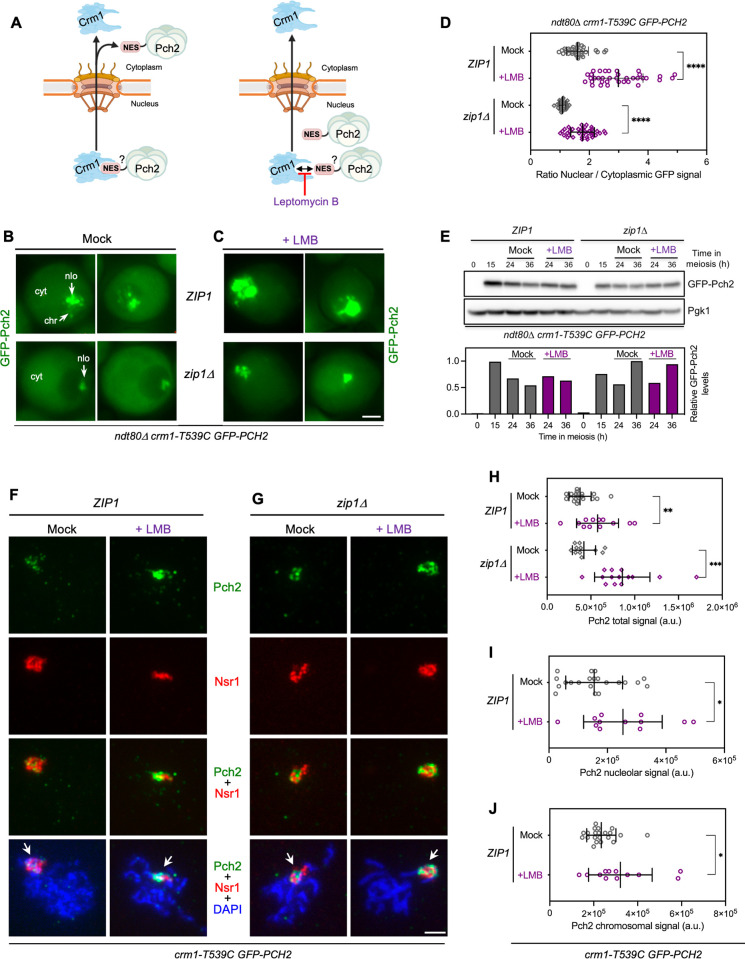
Fig 1. Nuclear export of Pch2 is blocked by leptomycin B (LMB).
(A) Schematic representation of protein nuclear export via nuclear pore complexes mediated by the interaction of a Nuclear Export Signal (NES) with the Crm1 exportin (see text for details). Leptomycin B (LMB) blocks NES binding to Crm1 preventing nuclear export. The presence of a putative NES in Pch2 is depicted. For simplicity, the NES is drawn only in one subunit of the Pch2 hexamer. BioRender.com was used to create this figure. (B, C) Fluorescence microscopy images of GFP-Pch2 localization in ZIP1 and zip1Δ cells, mock-treated (B), or treated with 500 ng/ml LMB (C), 15 h after meiotic induction. Images were taken at 24 h. Two representative individual cells for each condition are shown. Localization of GFP-Pch2 in the nucleolus (nlo), chromosomes (chr), and cytoplasm (cyt) is indicated. Scale bar, 2 μm. Strains are: DP1927 (ndt80Δ crm1-T539C GFP-PCH2) and DP1837 (zip1Δ ndt80Δ crm1-T539C GFP-PCH2). (D) Quantification of the ratio of nuclear (including nucleolar) to cytoplasmic GFP fluorescent signal for the experiment shown in (B, C). Error bars, SD. (E) Western blot analysis of GFP-Pch2 production (using anti-Pch2 antibodies) in the absence (mock) or presence of LMB. Pgk1 was used as loading control. The graph shows the quantification of GFP-Pch2 relative levels. (F, G) Immunofluorescence of spread meiotic chromosomes at pachytene stained with anti-Pch2 antibodies (to detect GFP-Pch2; green), anti-Nsr1 antibodies (red) and DAPI (blue). Representative ZIP1 (F) and zip1Δ (G) nuclei, mock-treated, or treated with 500 ng/ml LMB 15 h after meiotic induction are shown. Arrows point to the rDNA region. Spreads were prepared at 19 h. Scale bar, 2 μm. Strains are: DP1717 (crm1-T539C GFP-PCH2) and DP1721 (zip1Δ crm1-T539C GFP-PCH2). (H) Quantification of the GFP-Pch2 total signal for the experiment shown in (F, G). Error bars, SD; a.u., arbitrary units. (I-J) Quantification of the nucleolar (I) and chromosomal (J) GFP-Pch2 signal for the experiment shown in (F). Error bars, SD; a.u., arbitrary units.

