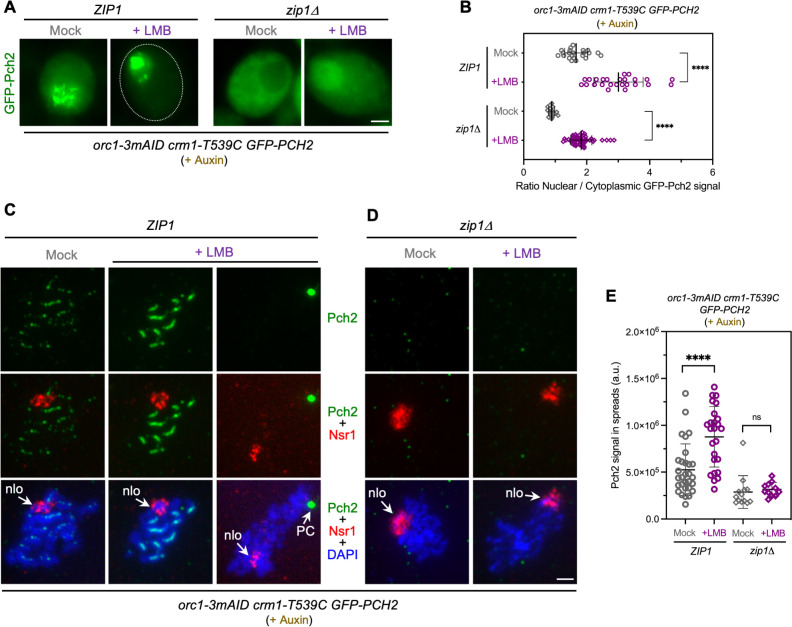
Fig 3. Pch2 nucleocytoplasmic traffic does not involve its association with Orc1 and Zip1.
(A) Fluorescence microscopy images of GFP-Pch2 localization in ZIP1 orc1-3mAID and zip1Δ orc1-3mAID cells, mock-treated, or treated with 500 ng/ml LMB, 15 h after meiotic induction. Auxin (500μM) was added to the cultures 12 h after meiotic induction to induce Orc1 degradation. Images were taken at 19 h. Cells representing the predominant GFP-Pch2 localization pattern for each condition are shown. Additional examples of GFP-Pch2 distribution are presented in S2D Fig. Scale bar, 2 μm. Strains are: DP1885 (orc1-3mAID crm1-T539C GFP-PCH2) and DP1886 (zip1Δ orc1-3mAID crm1-T539C GFP-PCH2). (B) Quantification of the ratio of nuclear (including nucleolar) to cytoplasmic GFP fluorescent signal for the experiment shown in (A). Error bars, SD. (C-D) Immunofluorescence of ZIP1 orc1-3mAID (C) and zip1Δ orc1-3mAID (D) spread meiotic chromosomes stained with anti-Pch2 (green) and anti-Nsr1 (red) antibodies, and DAPI (blue). Representative nuclei, either mock-treated, or treated with 500 ng/ml LMB 15 h after meiotic induction, are shown. Auxin (500 μM) was added to the cultures 12 h after meiotic induction to induce Orc1 degradation. Spreads were prepared at 19 h. Arrows point to the nucleolar region (nlo) and the Polycomplex (PC). Scale bar, 2 μm. The strains are the same used in (A). (E) Quantification of Pch2 signal for the experiment shown in (C-D). Error bars, SD; a.u., arbitrary units.

