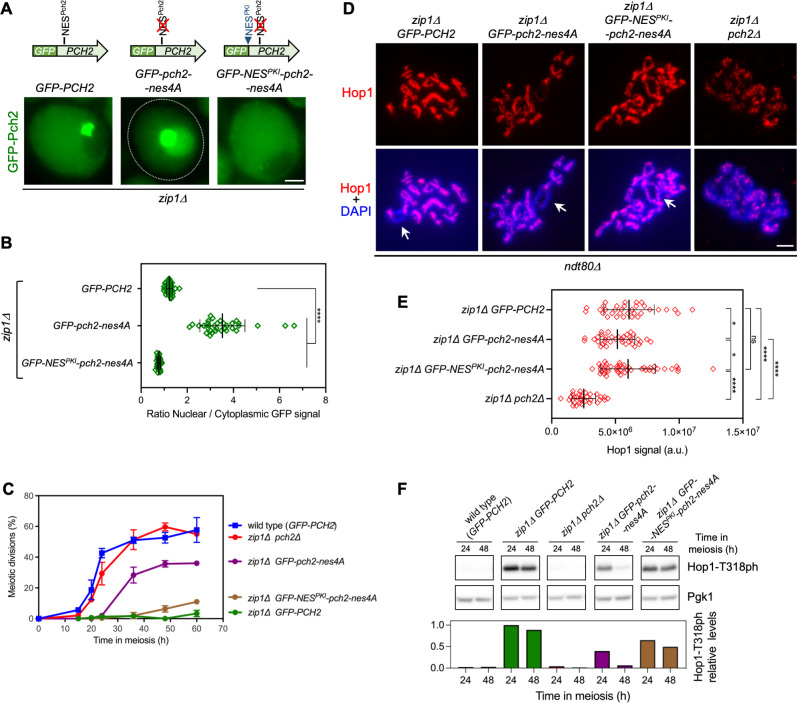
Fig 4. A functional NES in the NTD of Pch2 promotes its nuclear export.
(A) Fluorescence microscopy images of the localization of GFP-Pch2, GFP-Pch2-nes4A and GFP-NESPKI-Pch2-nes4A in zip1Δ cells. Images were taken 15 h after meiotic induction. Representative cells are shown. A schematic representation of the different GFP-Pch2 versions is also shown on top. Scale bar, 2 μm. Strains are: DP1625 (zip1Δ GFP-PCH2), DP1986 (zip1Δ GFP-pch2-nes4A) and DP1992 (zip1Δ GFP-NESPKI-pch2-nes4A). (B) Quantification of the ratio of nuclear (including nucleolar) to cytoplasmic GFP fluorescent signal for the experiment shown in (A). Error bars, SD. (C) Time course analysis of meiotic nuclear divisions; the percentage of cells containing two or more nuclei is represented. Error bars: SD; n = 3. At least 300 cells were scored for each strain at every time point. Strains are: DP1624 (GFP-PCH2), DP1625 (zip1Δ GFP-PCH2), DP1029 (zip1Δ pch2Δ), DP1986 (zip1Δ GFP-pch2-nes4A) and DP1992 (zip1Δ GFP-NESPKI-pch2-nes4A). (D) Immunofluorescence of spread meiotic chromosomes stained with anti-Hop1 antibodies and DAPI (blue). Representative nuclei from prophase-arrested ndt80Δ strains are shown. Arrows point to the rDNA region. Spreads were prepared at 24 h. Scale bar, 2 μm. Strains are: DP1655 (ndt80Δ zip1Δ GFP-PCH2), DP1988 (ndt80Δ zip1Δ GFP-pch2-nes4A), DP2003 (ndt80Δ zip1Δ GFP-NESPKI-pch2-nes4A), and DP881 (ndt80Δ zip1Δ pch2Δ). (E) Quantification of the Hop1 signal for the experiment shown in (D). (F) Western blot analysis of Hop1-T318 phosphorylation in the strains analyzed in (C) at the indicated time points in meiosis. Pgk1 was used as a loading control. The graph shows the quantification of Hop1-T318ph relative levels.

