
Fig 3. Presence-absence bubble plot for the top 26 pathways perturbed in a time course co-culture experiment between non-activated (no TNF) HBMEC and IT4var14 and RBC.
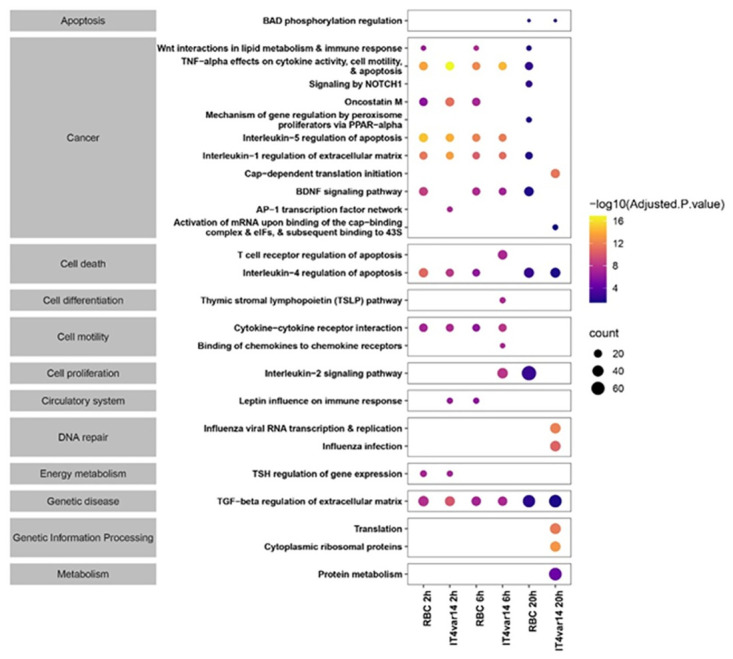
The size and colour of the bubbles represent the gene counts (number of genes associated with the pathway) and their statistical significance (-log10(Adjusted p-value)). The broad categorization of pathways was obtained from Bioplanet [31].