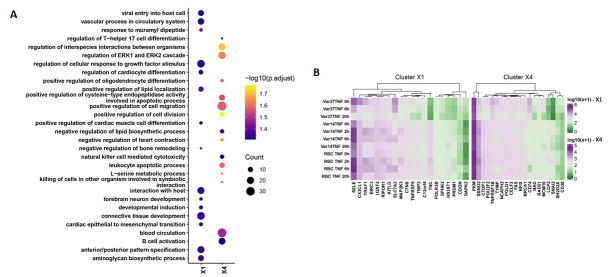
Fig 9. Analysis of differential expression between IT4var14 and IT4var37 experiments.
(A) GO pathway analysis (Biological processes and molecular function) of the clusters showing differential patterns of expression in IT4var14 and IT4var37 co-culture with HBMEC (S10 File). The outcome is represented as presence-absence bubble plot for perturbed pathways (top 15 enriched pathways obtained from cluster X1 and X4). The bubble size and colour respectively depict the gene counts (number of genes associated with pathway) and their statistical significance (-log10(Adjusted p-value)). (B)Heatmap of gene expression perturbation for 20 genes in cluster X1 and X4 each (top 10 Upregulated and 10 Downregulated). The expression values are plotted as mean of normalized counts followed by log10 transformation.

