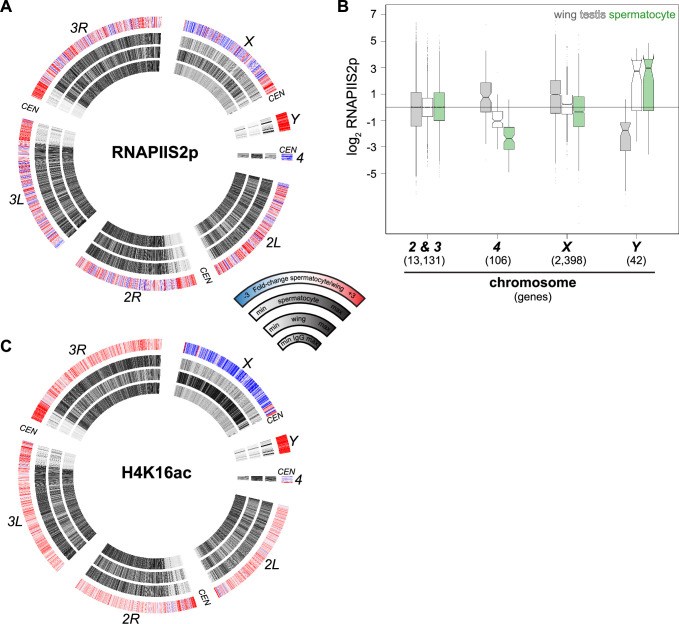
Figure 4. Chromosomal distribution of RNA polymerase II and H4K16ac in isolated spermatocytes.
(A) CIRCOS plot of RNAPIIS2p across Drosophila chromosomes. The signal (black) in IgG controls, in wing imaginal discs, and in isolated spermatocytes is shown in internal rings, and the log2fold-change of signals between spermatocytes and wings is shown in the outer ring. (B) Enrichment of RNAPIIS2p across gene bodies in wing imaginal discs, in whole dissociated testes, and in isolated spermatocytes separated by chromosomal location. Scores are scaled to the median score on the second and third chromosomes. (C) CIRCOS plot of the dosage-compensation marker histone H4K16ac across Drosophila chromosomes. Signal (black) in IgG controls, in wing imaginal discs, and in isolated spermatocytes is shown in internal rings, and the log2fold-change of signals between spermatocytes and wings is shown in the outer ring.

