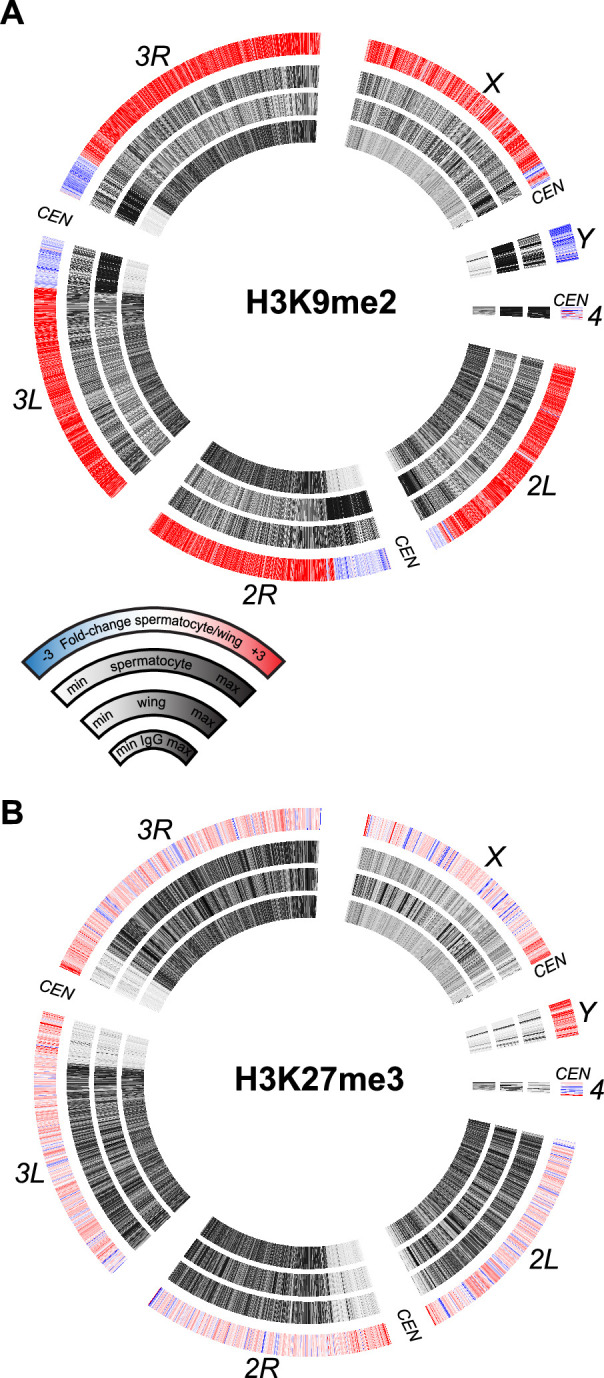
Figure 5. Chromosomal distribution of repressive histone modifications in isolated spermatocytes.

CIRCOS plots across Drosophila chromosomes show signal (black) in IgG controls, in wing imaginal discs, and in isolated spermatocytes in internal rings, and the log2fold-change of signals between spermatocytes and wings in the outer ring. (A) Distribution of the heterochromatin-silencing marker H3K9me2. (B) Distribution of the Polycomb-silencing marker H3K27me3.
