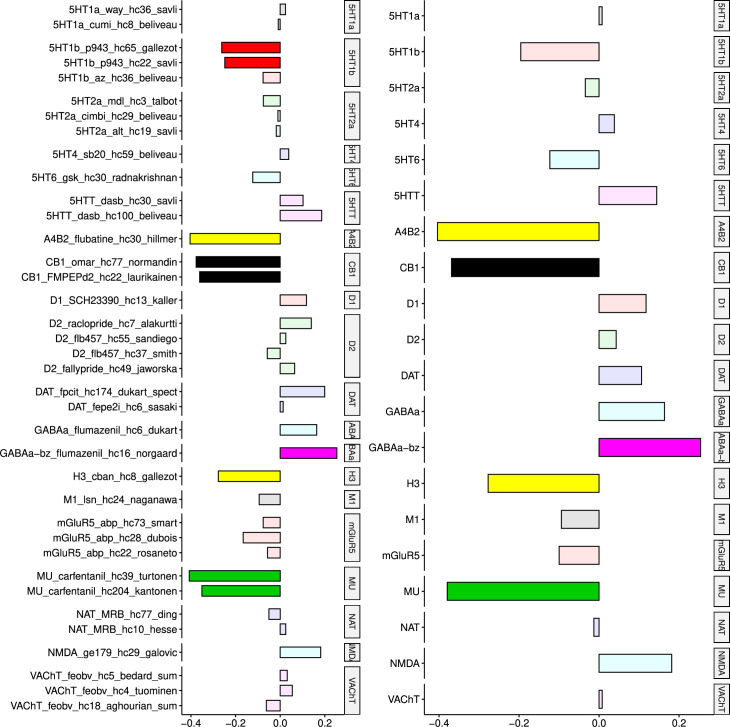
Appendix 2—figure 9. Body mass index: correlations of cortical neurotransmitter maps from the literature with the NODDI ICVF-BMI maps shown above.
Significance after Bonferroni correction is indicated by shading. Left: individual studies, right: same neurotransmitters from different studies combined. The CB1 (cannabinoid) receptors show the maximum (absolute) correlation with the maps of microstructural effect of obesity.

