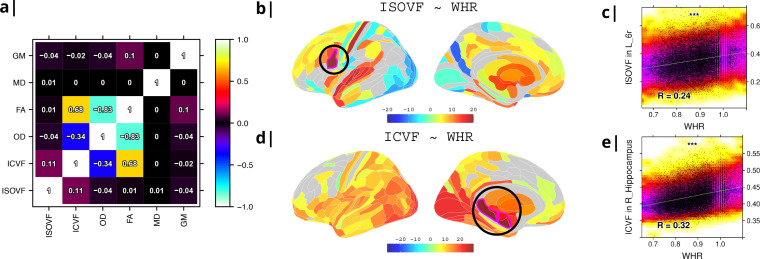
Figure 1. Micro-structural MRI metrics are associated with waist-to-hip ratio (WHR).
(a) Correlation matrix for six macro- and micro/structural MRI metrics demonstrating that ISOVF (free-water) is essentially orthogonal to ICVF (neurite density) and OD, which instead form a cluster with FA. (b) Cortical and subcortical t-score map (left lateral and medial hemispheres) of ISOVF~WHR, representing the association of regional ISOVF with WHR, thresholded for significance at FDR = 5%. Circles indicate regions for which scatterplots are shown on the right. (c) Scatterplot of ISOVF in left inferior premotor region 6 r (y-axis) versus WHR (x-axis). (d) Cortical and subcortical t-score map of ICVF~WHR, thresholded at FDR = 5%. (e) Scatterplot of ICVF in the right hippocampus versus WHR. The maps of ISOVF~WHR and ICVF~WHR were negatively correlated (, ). Colors in (b and d) refer to t-scores, colors in (c and e) denote normalised density. GM = Grey Matter; MD = Mean Diffusivity; FA = Fractional Anisotropy; OD = Orientation Dispersion Index; ISOVF = isotropic volume fraction; ICVF = intra-cellular volume fraction.

