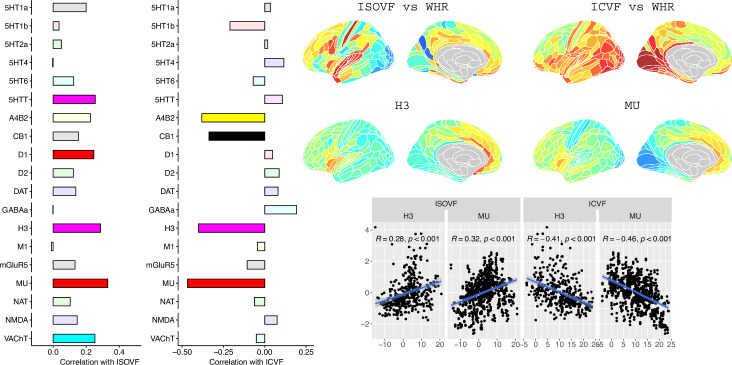
Figure 3. Co-location of neurotransmitter receptor or transporter distributions with obesity-associated micro-structural MRI systems.
Left: Correlations of cortical neurotransmitter maps with the ISOVF~WHR and ICVF~WHR maps shown above (same color scale as in Figure 1). Significance is indicated by shading (based on spin permutation and Bonferroni correction). The Mu and H3 receptors show the maximum (absolute) correlation with the ISOVF and ICVF maps of microstructural effect of obesity (top right). Bottom right: scatter plots of raw data.

