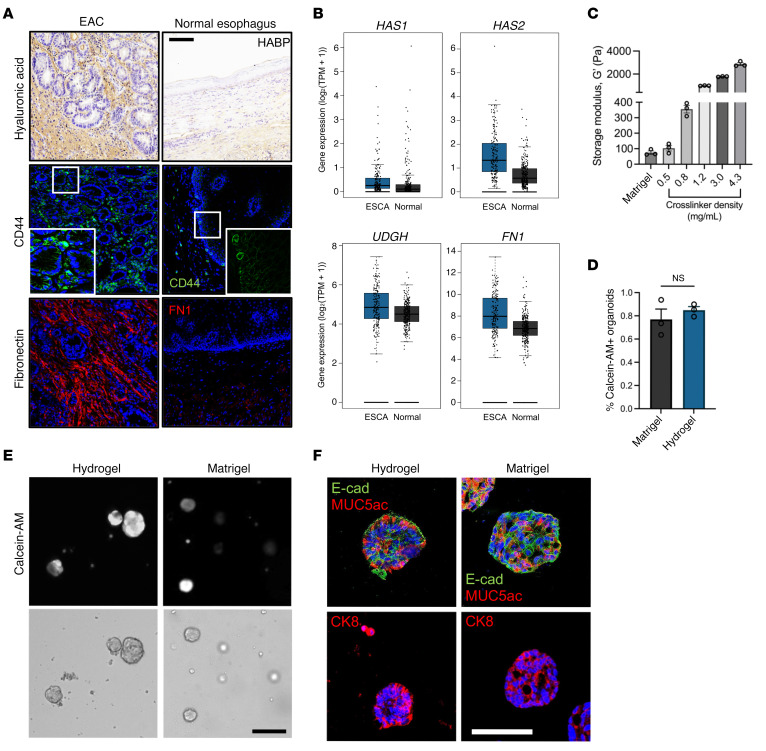
Figure 1. Engineered hydrogel supports EAC PDO development.
(A) Images of patient tissue sections from normal and EAC biopsies stained for HA (HABP), CD44, or fibronectin (FN1). Scale bar: 100 μm. Original magnification, ×5 (insets). (B) Bulk RNA-Seq analysis of ESCA and normal pancreatic tissue samples for fibronectin and hyaluronan-associated genes (HAS1, HAS2, UGDH). n = 286 for ESCA; n = 283 for normal. (C) Relationship between crosslinker density (mg/mL) and storage modulus, G′ (mean ± SEM; n = 3 independently prepared hydrogels per condition). (D) Quantification of PDO viability as assessed by calcein-AM labeling at 7 days after encapsulation. Viability is quantified as the percentage of PDOs that stained positive for calcein-AM (mean ± SEM; n = average number of calcein-AM+ organoids per hydrogel; at least 20 organoids per hydrogel were analyzed). Welch’s t test with 2-tailed comparison showed no significant differences between groups. NS = P > 0.05. (E) Representative transmitted light and fluorescence microscopy images of EAC PDOs cultured in NorHA hydrogels or Matrigel. Scale bar: 200 μm. (F) Representative fluorescence microcopy images of EAC PDOs within NorHA hydrogels stained for MUC5ac, E-cad, and CK8 at 14 days after encapsulation. Scale bar: 50 μm. Three independent experiments were performed, and data are presented for 1 of the experiments. Every independent experiment was performed with 4 gel samples per experimental group.

