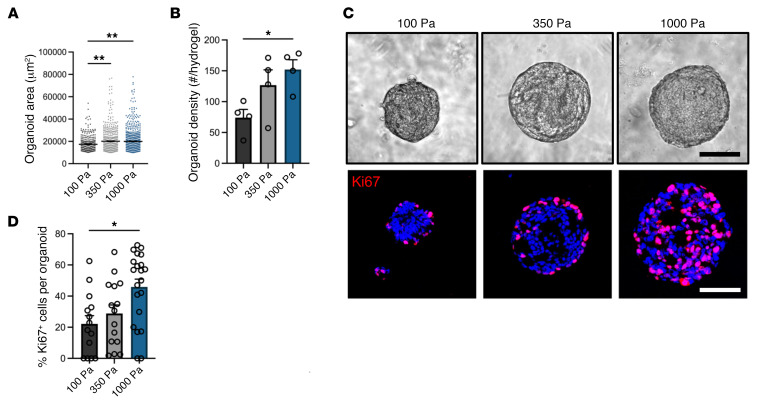
Figure 2. Engineered hydrogel stiffness modulates EAC PDO development.
(A) Quantification of PDO (A) size (area) and (B) density as a function of matrix stiffness at 14 days after encapsulation. Data are represented as mean ± SEM. (A) n = at least 300 organoids analyzed across 4 hydrogels per group; (B) n = 4 hydrogels per group. (A and B) Kruskal-Wallis test with Dunn’s multiple-comparisons test showed significant differences between 100 Pa and 350 Pa or 1000 Pa. (C) Representative transmitted light and fluorescence microscopy images of EAC PDOs and (D) quantification of proliferating cells (%Ki67+) in EAC PDOs cultured in NorHA hydrogels of different stiffnesses at 14 days after encapsulation. Data are represented as mean ± SEM. n = at least 15 organoids analyzed per group. Kruskal-Wallis test with Dunn’s multiple-comparisons test showed significant differences between 100 Pa and 1000 Pa. Scale bar: 100 μm. (A–D) Three independent experiments were performed, and data are presented for 1 of the experiments. Every independent experiment was performed with 4 gel samples per experimental group. *P < 0.05; **P < 0.01.

