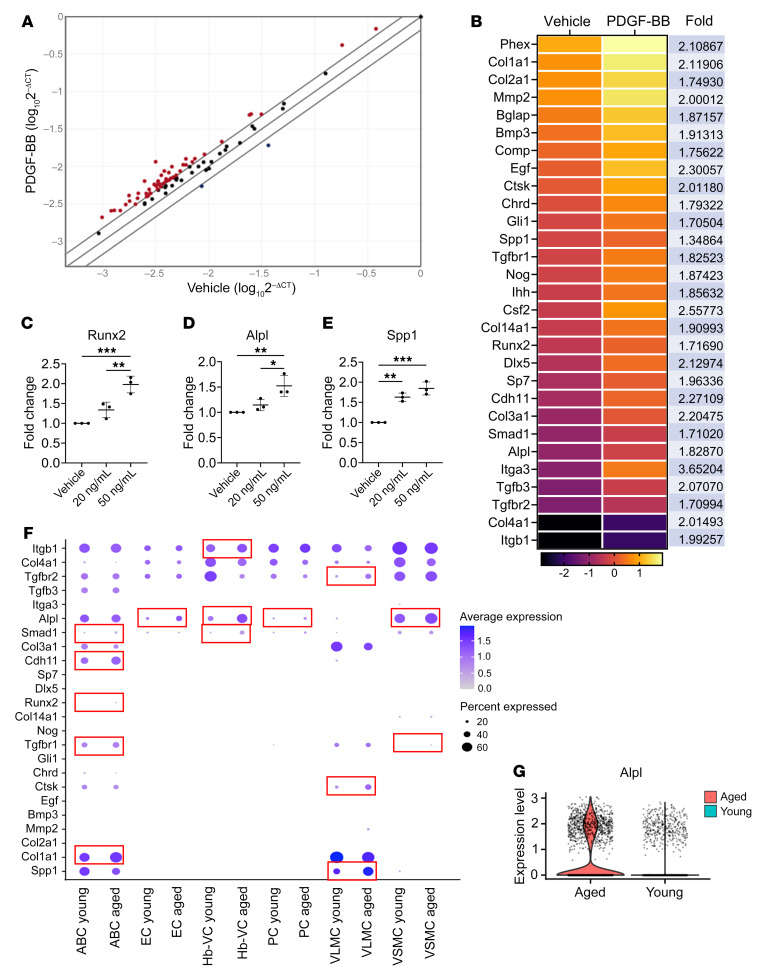
Figure 5. PDGFBB activates osteogenic differentiation–associated genes in the cerebral vasculature.
(A and B) Osteogenic gene array analysis of cultured brain microvessels treated with or without 20 ng/mL PDGF-BB. (A) Expression levels of 84 osteogenesis-related genes are compared. Expression levels (2–ΔCt) of these genes are plotted on a logarithmic scale. The 2 boundary lines above and below the center partition line indicate the threshold of 1.5-fold upregulation and downregulation between the groups. Genes with at least 1.5-fold higher expression in PDGF-BB–treated vessels compared with vehicle-treated vessels are shown as red dots (the gene names and fold changes are listed in B). (B) Heatmap shows statistically significantly regulated genes (>1.5-fold and P < 0.05) in PDGF-BB–treated versus vehicle-treated microvessels. n = 2. (C–E) qRT-PCR analysis of Runx2, Alpl, and Spp1 mRNA expression levels in isolated mouse brain vessels with different concentrations of PDGF-BB treatment for 16 hours. n = 3. (F) Dot plots of osteogenic gene expression in different subtypes of vascular cells from young and aged mouse brains by analysis of a scRNA-Seq data set (GEO GSE129788) (see detailed information in Methods). (G) Violin plot shows substantially increased expression of Alpl in cerebral vascular cells in the aging mouse brain. *P < 0.05, **P < 0.01, and ***P < 0.001, by ordinary 1-way ANOVA for multiple-group comparisons (C–E).

