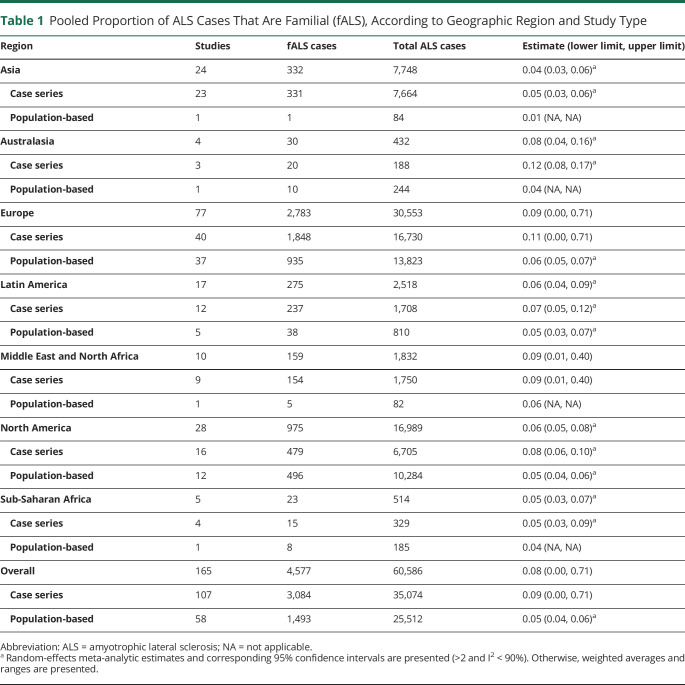
Table 1.
Pooled Proportion of ALS Cases That Are Familial (fALS), According to Geographic Region and Study Type
| Region | Studies | fALS cases | Total ALS cases | Estimate (lower limit, upper limit) |
| Asia | 24 | 332 | 7,748 | 0.04 (0.03, 0.06)a |
| Case series | 23 | 331 | 7,664 | 0.05 (0.03, 0.06)a |
| Population-based | 1 | 1 | 84 | 0.01 (NA, NA) |
| Australasia | 4 | 30 | 432 | 0.08 (0.04, 0.16)a |
| Case series | 3 | 20 | 188 | 0.12 (0.08, 0.17)a |
| Population-based | 1 | 10 | 244 | 0.04 (NA, NA) |
| Europe | 77 | 2,783 | 30,553 | 0.09 (0.00, 0.71) |
| Case series | 40 | 1,848 | 16,730 | 0.11 (0.00, 0.71) |
| Population-based | 37 | 935 | 13,823 | 0.06 (0.05, 0.07)a |
| Latin America | 17 | 275 | 2,518 | 0.06 (0.04, 0.09)a |
| Case series | 12 | 237 | 1,708 | 0.07 (0.05, 0.12)a |
| Population-based | 5 | 38 | 810 | 0.05 (0.03, 0.07)a |
| Middle East and North Africa | 10 | 159 | 1,832 | 0.09 (0.01, 0.40) |
| Case series | 9 | 154 | 1,750 | 0.09 (0.01, 0.40) |
| Population-based | 1 | 5 | 82 | 0.06 (NA, NA) |
| North America | 28 | 975 | 16,989 | 0.06 (0.05, 0.08)a |
| Case series | 16 | 479 | 6,705 | 0.08 (0.06, 0.10)a |
| Population-based | 12 | 496 | 10,284 | 0.05 (0.04, 0.06)a |
| Sub-Saharan Africa | 5 | 23 | 514 | 0.05 (0.03, 0.07)a |
| Case series | 4 | 15 | 329 | 0.05 (0.03, 0.09)a |
| Population-based | 1 | 8 | 185 | 0.04 (NA, NA) |
| Overall | 165 | 4,577 | 60,586 | 0.08 (0.00, 0.71) |
| Case series | 107 | 3,084 | 35,074 | 0.09 (0.00, 0.71) |
| Population-based | 58 | 1,493 | 25,512 | 0.05 (0.04, 0.06)a |
Abbreviation: ALS = amyotrophic lateral sclerosis; NA = not applicable.
Random-effects meta-analytic estimates and corresponding 95% confidence intervals are presented (>2 and I2 < 90%). Otherwise, weighted averages and ranges are presented.

