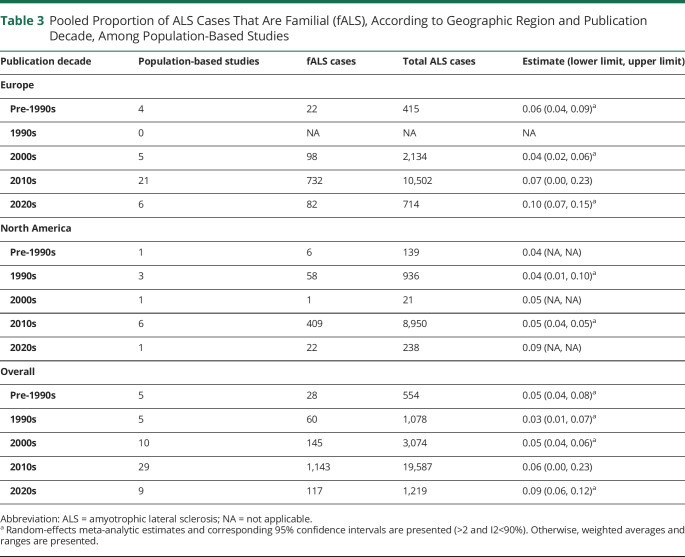
Table 3.
Pooled Proportion of ALS Cases That Are Familial (fALS), According to Geographic Region and Publication Decade, Among Population-Based Studies
| Publication decade | Population-based studies | fALS cases | Total ALS cases | Estimate (lower limit, upper limit) |
| Europe | ||||
| Pre-1990s | 4 | 22 | 415 | 0.06 (0.04, 0.09)a |
| 1990s | 0 | NA | NA | NA |
| 2000s | 5 | 98 | 2,134 | 0.04 (0.02, 0.06)a |
| 2010s | 21 | 732 | 10,502 | 0.07 (0.00, 0.23) |
| 2020s | 6 | 82 | 714 | 0.10 (0.07, 0.15)a |
| North America | ||||
| Pre-1990s | 1 | 6 | 139 | 0.04 (NA, NA) |
| 1990s | 3 | 58 | 936 | 0.04 (0.01, 0.10)a |
| 2000s | 1 | 1 | 21 | 0.05 (NA, NA) |
| 2010s | 6 | 409 | 8,950 | 0.05 (0.04, 0.05)a |
| 2020s | 1 | 22 | 238 | 0.09 (NA, NA) |
| Overall | ||||
| Pre-1990s | 5 | 28 | 554 | 0.05 (0.04, 0.08)a |
| 1990s | 5 | 60 | 1,078 | 0.03 (0.01, 0.07)a |
| 2000s | 10 | 145 | 3,074 | 0.05 (0.04, 0.06)a |
| 2010s | 29 | 1,143 | 19,587 | 0.06 (0.00, 0.23) |
| 2020s | 9 | 117 | 1,219 | 0.09 (0.06, 0.12)a |
Abbreviation: ALS = amyotrophic lateral sclerosis; NA = not applicable.
Random-effects meta-analytic estimates and corresponding 95% confidence intervals are presented (>2 and I2<90%). Otherwise, weighted averages and ranges are presented.

