Figure 2.

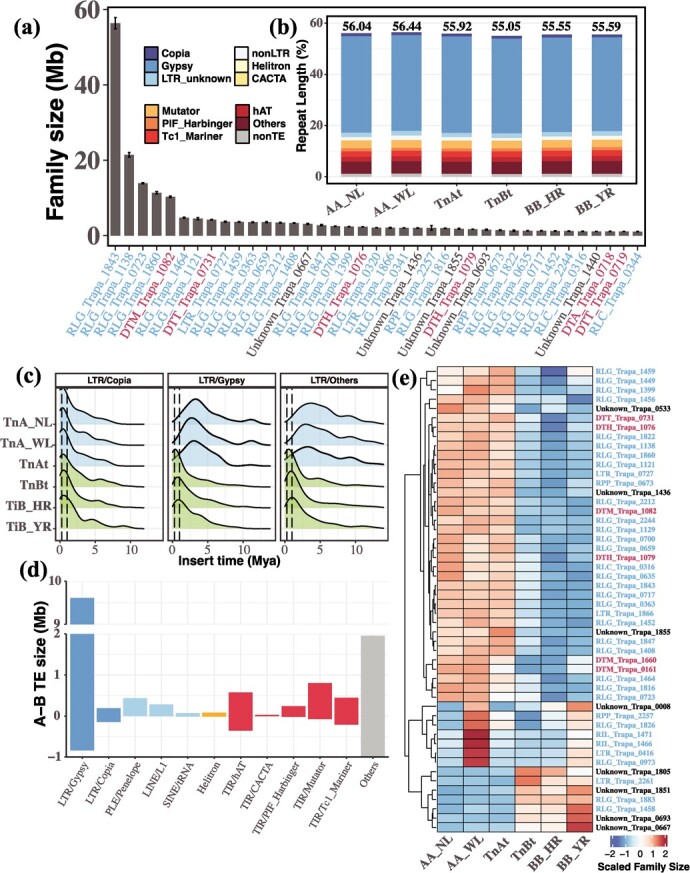
The landscape and insertion times of transposable elements (TEs) of Trapa. (a) Mean size of the 39 largest TE families (>1 Mb) across the six (sub)genomes (diploid T. natans: TnA_NL and TnA_WL; diploid T. incisa: TiB_HR and TiB_YR; allotetraploid T. natans: TnAt snd TnBt). The x-axis indicates the names of the TE families (blue: retrotransposons; red: DNA transposons). The error bars denote the standard deviation among the six (sub)genomes of Trapa. (b) Length (%) of repetitive elements per (sub)genome, as inferred by panEDTA annotation. (c) Estimated insertion times (in million years ago, Mya) of full-length long terminal repeat (FL-LTR) retrotransposons (Copia, Gypsy, and others) for each (sub)genome. Density distributions represent the A- (TnA_NL, TnA_WL, and TnAt) and B- (TiB_HR, TiB_YR, and TnBt) lineages, respectively. The two dashed lines represent the inferred times of the allotetraploidization (left, c. 0.27 Mya) and the divergence between diploid T. incisa and T. natans (right, c. 1 Mya). (d) Size differences in major TE families between the A- and B-lineages. Positive values represent families that are larger in the A-lineage than in the B-lineage, while negative values represent those that are larger in the B-lineage than in the A-lineage. (e) Heatmap of the scaled sizes of the 50 most different TE families between A- and B-lineages. Column names in blue vs. red indicate retrotransposons vs. DNA transposons.
