
Figure 3.
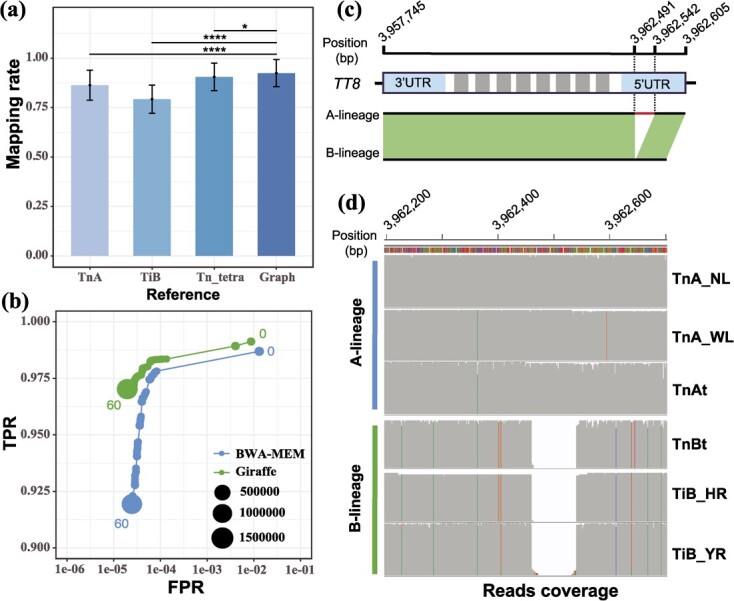
Comparison of mapping accuracy between graph and linear genomes. (a) The genome mapping rate of re-sequenced individuals with respect to three reference genomes of diploid T. natans (TnA), diploid T. incisa (TiB), and allotetraploid T. natans (Tn_tetra) and the graph-based pangenome of Trapa, respectively. (b) Receiver operating characteristic (ROC) graph illustrating true-positive vs. false-positive rates (TPRs vs. FPRs) at different mapping quality thresholds (i = 0–60) for graph-based and linear genome mapping approaches, respectively. The size of each circle is proportional to the log-scaled number of reads with the respective mapping quality. (c) An 80-bp deletion is located within the 5’UTR of the TT8 gene of B lineage. The blue and grey boxs represent UTRs and exons, respectively. (d) Validation of the deletion based on the mapping of Pac Bio long reads onto the genome assembly of TnA_NL.