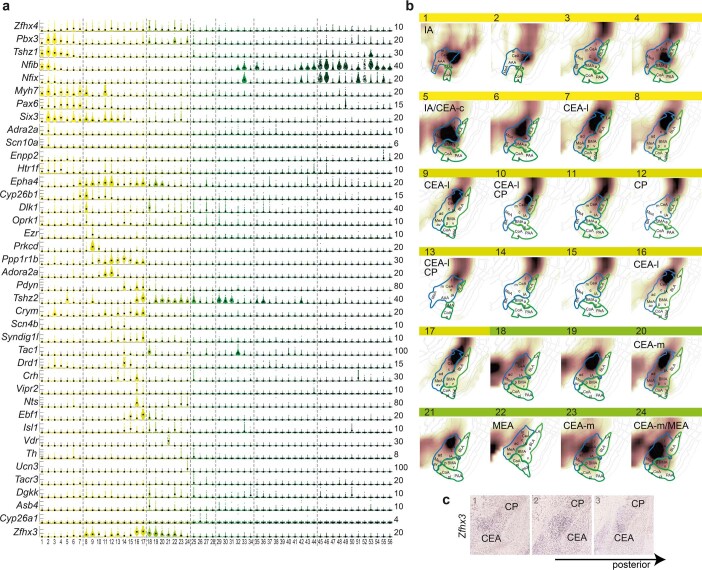
Extended Data Fig. 5. GABAergic populations of intercalated (IA) and central (CEA) amygdala.
a, Gene expression in IA and CEA populations (GABA1-24), visualized as single-cell violin plots. Each dot represents one cell; black square, median expression, number of molecules (y-scale maximum) on the right. b, Inferred spatial distributions of GABA populations 1-24 using AMBA volumetric expression ISH data. Correlation coefficients visualized as a heat map on relevant coronal sections; white, low; brown, high correlation. c Expression of Zfhx3 (Allen Mouse Brain Atlas https://mouse.brain-map.org/experiment/show/74641308) is enriched in the CEA, compared to surrounding and related structures, such as dorsally neighboring striatal caudoputamen (CP).

