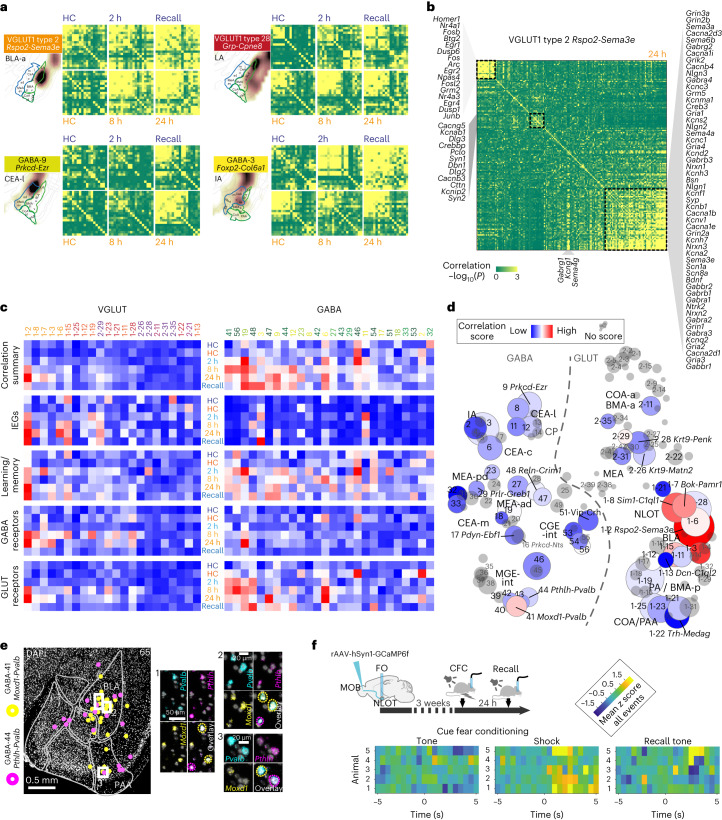
Fig. 6. Gene expression correlation identifies cell types with CFC-activated learning gene modules.
a, Pearson pairwise correlation (green, low and yellow, high) of 18 IEGs for four cell types, resolved by post-CFC sampling timepoint and batch-specific HC control. For each cell type; top row, batch B (HC-2 h-recall); bottom row, batch A (HC-8 h-24 h); genes ordered by hierarchical clustering. b, Pairwise correlation of 156 learning-related genes, in VGLUT1 type 2, 24 h post CFC, with three correlated gene expression modules highlighted. Pearson coefficient (green, low and yellow, high), genes are ordered by hierarchical clustering. c, Time-resolved correlation, per experimental group (post-CFC, HC controls), for large clusters (smallest group in cluster 20 cells), for gene modules indicated, or all genes combined (‘correlation summary’). d, CFC-induced correlation across the full amygdala taxonomy, visualized as heatmap on t-SNE (as in Fig. 1b). Pairwise correlation score (gray, no score (smallest group in cluster <20 cells)). Circle size represents cluster size. c,d, Pearson pairwise correlation score (blue, low and red, high). e, Multiplex fluorescent in situ hybridization validates two Pvalb+ interneuron populations GABA-41 and GABA-44 (with different transcriptional responses to CFC) had similar spatial distributions primarily in the BLA. f, Targeting strategy for validation of NLOT participation in CFC via retrograde labeling of MOB-projecting neurons with GCaMP6f, and fiberphotometry recording in NLOT, during CFC and recall. Mean z score of NLOT calcium activity recorded in seven CFC tone-shock pairings (left), and four no-shock tone recall events (right), visualized as heatmap 5 seconds before and after the event, for five mice (rows).

