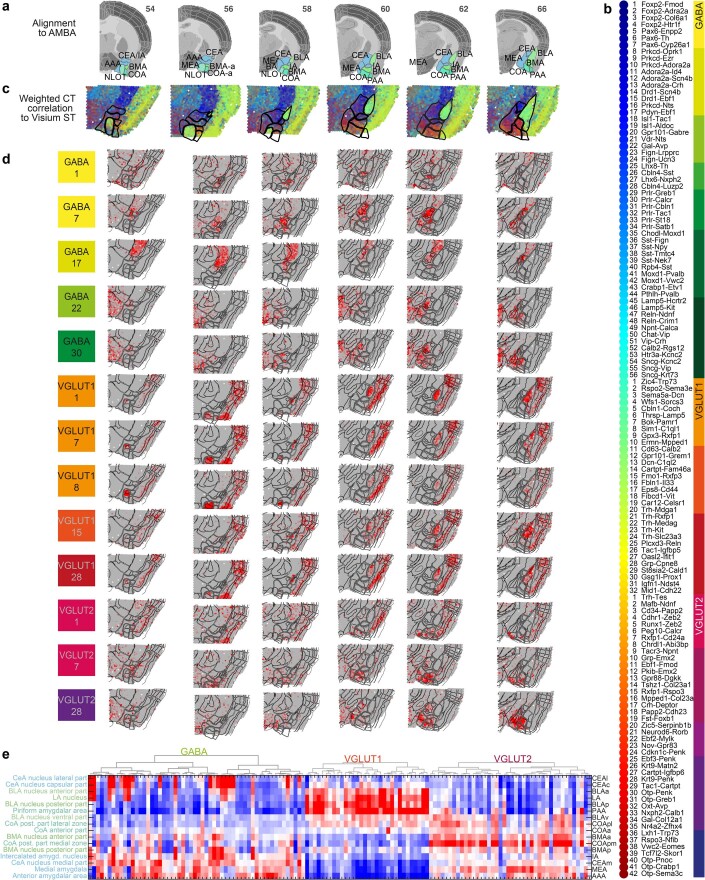
Extended Data Fig. 2. Spatial transcriptomics (Visium) for cell type mapping.
a, Sample and section overview. 6 coronal sections covering the anterior-posterior amygdala; with alignment to reference sections (adjusted from Allen Reference Atlas – Mouse Brain (atlas.brain-map.org), and amygdala regions highlighted for anatomical reference. b, Cell types in dendrogram order, with color map for branches (right), and cluster colors (left). c, Spatial mapping of 130 neuronal clusters to Visium ST sections, visualized by weighted correlation of scRNA-seq-derived cell type profiles (b) to Visium ST capture spots. d, Correlation heatmap between spatial transcriptomics and 13 cell types (examples), visualized on the Visium ST sections. Gray, low; red, high correlation. e, Correlation heatmap between spatial transcriptomics expression annotated to amygdala regions (rows, ordered by similarity) and all 130 cell types (dendrogram order, as b). Blue, low; red, high correlation.

