
Fig. 1. Cryo-EM reconstructions of Aβ fibrils extracted from APP/PS1, ARTE10, tg-SwDI, tg-APPSwe, APP23 and tg-APPArcSwe mouse brain tissue.
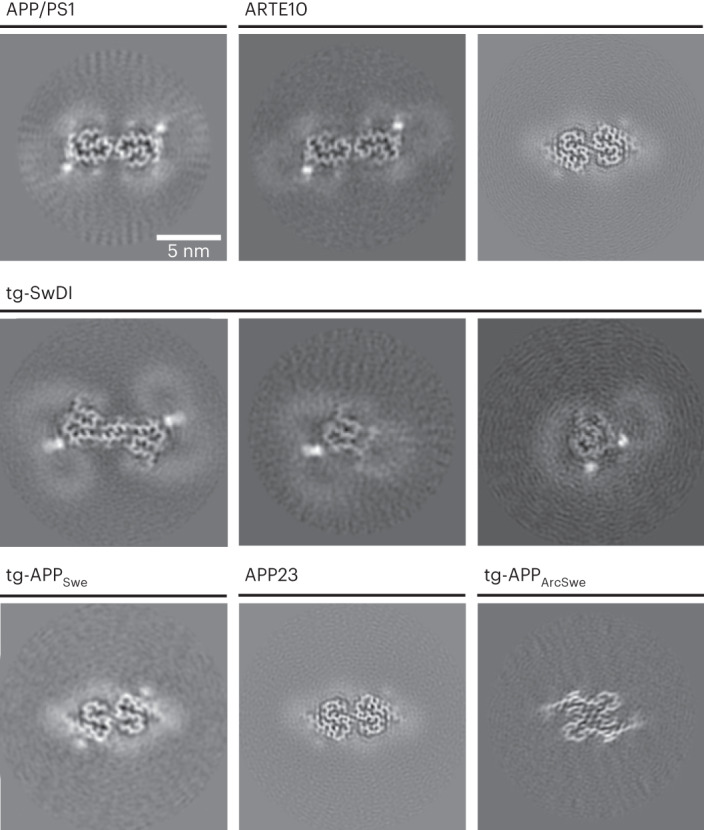
For every reconstructed fibril, a projection of the reconstructed density including approximately one β-rung is shown. The scale bar in the top left panel applies to all shown panels. From upper left to lower right: murine type III (APP/PS1), murine type III (ARTE10), murine type II (ARTE10), DI1, DI2, DI3, murine type II (tg-APPSwe), murine type II (APP23) and murineArc type I. The number of fibril segments used to generate the reconstructions is given in Extended Data Table 2.