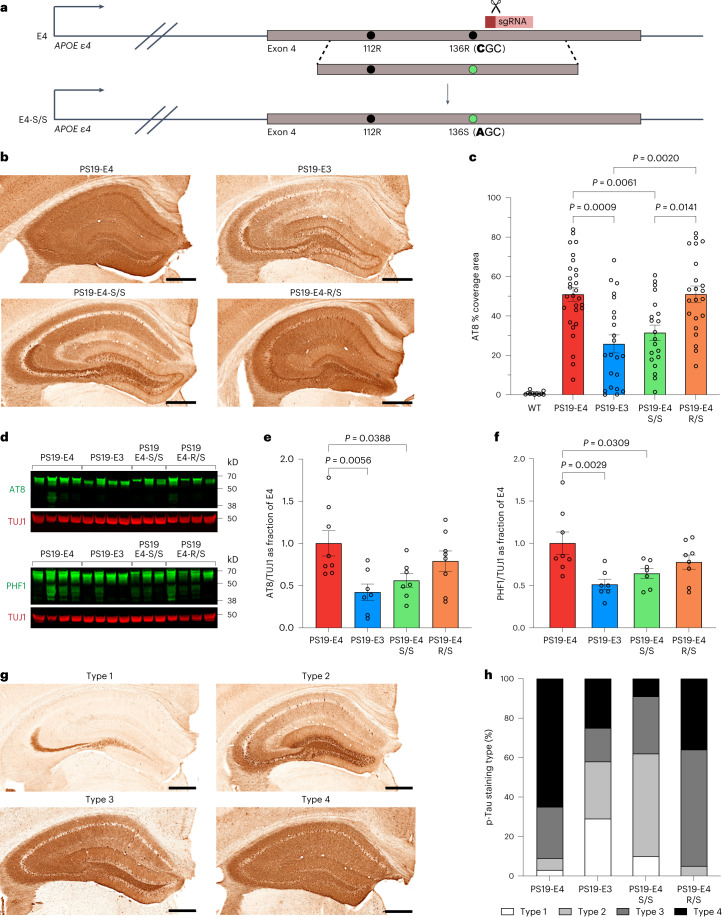
Fig. 1. Homozygous R136S mutation rescues APOE4-promoted Tau pathology in tauopathy mice.
a, Schematic of CRISPR–Cas-9-mediated gene editing strategy to generate human APOE4-R136S knock-in mice. b, Representative images of p-Tau immunostaining in hippocampus of 10-month-old PS19-E4, PS19-E3, PS19-E4-S/S and PS19-E4-R/S mice with the AT8 monoclonal antibody. c, Quantification of the percent AT8 coverage area in the hippocampus of these mice (PS19-E4, n = 29; PS19-E3, n = 22; PS19-E4-S/S, n = 20; PS19-E4-R/S, n = 22) and WT mice (n = 11). d, Representative western blot images with p-Tau-specific AT8 or PHF1 antibody. TUJ1 was used as a loading control. e,f, Quantification of AT8+ (e) and PHF1+ (f) p-Tau levels in hippocampal lysates of PS19-E4 (n = 8), PS19-E3 (n = 7), PS19-E4-S/S (n = 7) and PS19-E4-R/S (n = 8) mice. p-Tau levels were normalized to TUJ1 first and then to those of PS19-E4 mice. g, Representative images of four AT8 staining patterns in the hippocampus. h, Distribution of four p-Tau staining patterns in the hippocampus of 10-month-old PS19-E4, PS19-E3, PS19-E4-S/S and PS19-E4-R/S mice (PS19-E4, n = 29; PS19-E3, n = 22; PS19-E4-S/S, n = 20; PS19-E4-R/S, n = 22). Scale bars in b and g, 500 µm. Throughout, data are expressed as mean ± s.e.m. Differences between groups were determined by Welch’s ANOVA followed by Dunnett’s T3 multiple comparison test (c) or ordinary one-way ANOVA followed by Dunnett’s multiple comparison test (e,f). Comparisons of P ≤ 0.05 are labeled on the graph.

