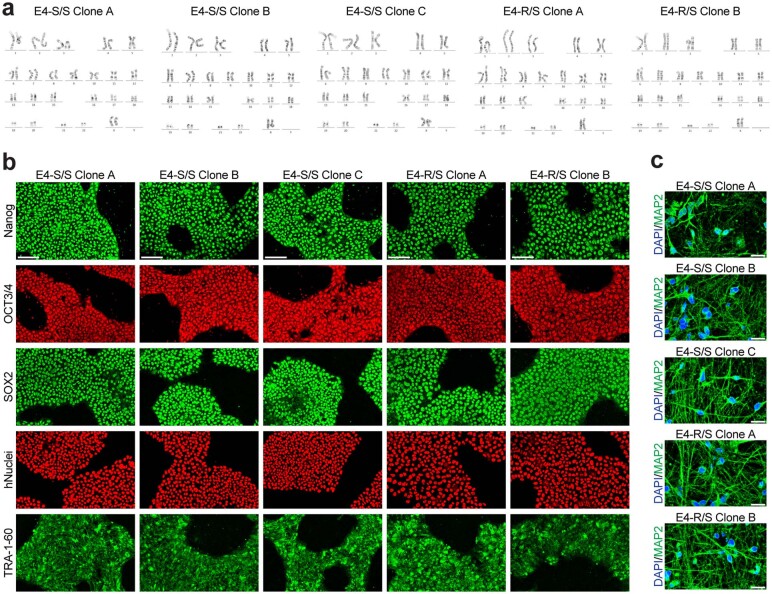
Extended Data Fig. 3. Characterization of E4-S/S and E4-R/S hiPSC lines and neuronal differentiation.
a, Karyogram of E4-S/S-A, E4-S/S-B, E4-S/S-C, E4-R/S-A, and E4-R/S-B hiPSC lines. For all cell lines, metaphase was examined for n = 20 cells per line. b, Representative immunofluorescent images of pluripotent stem cell markers Nanog, OCT3/4, SOX2, hNuclei, and TRA-1-60 from E4-S/S-A, E4-S/S-B, E4-S/S-C, E4-R/S-A, and E4-R/S-B hiPSC lines (scale bar, 100 μm). c, Representative immunofluorescent images of mature neuronal marker MAP2 (green) and DAPI (blue) in 3-week-old neurons differentiated from E4-S/S-A, E4-S/S-B, E4-S/S-C, E4-R/S-A, and E4-R/S-B hiPSC lines (scale bar, 20 μm). Representative images were selected from n = 3 fields of view from each cell line.

