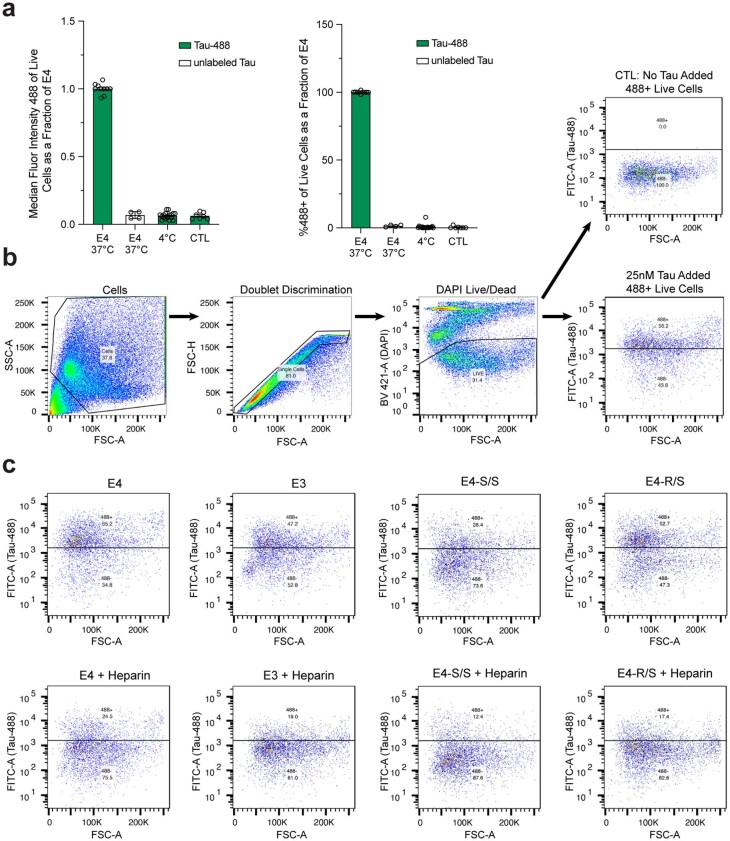
Extended Data Fig. 4. Measurement of neuronal uptake of Tau-488 by flow cytometry.
a, Internal controls of Tau-488 uptake assay as measured by median fluorescent intensity at 488 nm of live cell population (left) or % 488-positive live cell population (right) via flow cytometry. All values normalized to E4 cells at 37 °C, collected over separate experiments. Samples treated with Tau-488 are colored in green and samples treated with unlabeled tau are colored in white. E4 at 37 °C with Tau-488, n = 10; E4 at 37 °C with unlabeled Tau, n = 4; E4 at 4 °C with Tau-488, n = 18; E4 at 37 °C no Tau CTL, n = 7; n=independent experiment with unique biological samples. b, Gating strategy for Tau uptake assay. First, cells were gated on forward scatter/side scatter (FSC/SSC). Cells were then gated on forward scatter height (FSC-H) versus area (FSC-A) to discriminate doublets. Dead cells were removed from the analysis using nuclear stain with DAPI, and positive cells were determined by gating on a control (no Tau-488 added) population. c, Scatter plots of flow cytometry analysis of live cell population at 488 nm (FITC-A versus FSC-A) for E4, E3, E4-S/S, or E4-R/S neuronal cultures with or without the treatment with 100 µg/ml heparin. Roughly 1×10⁵ to 5×10⁵ events were recorded in each experiment. The live cell population analyzed was roughly 5000 cells for each sample. In a, data are expressed as mean ± s.e.m.

