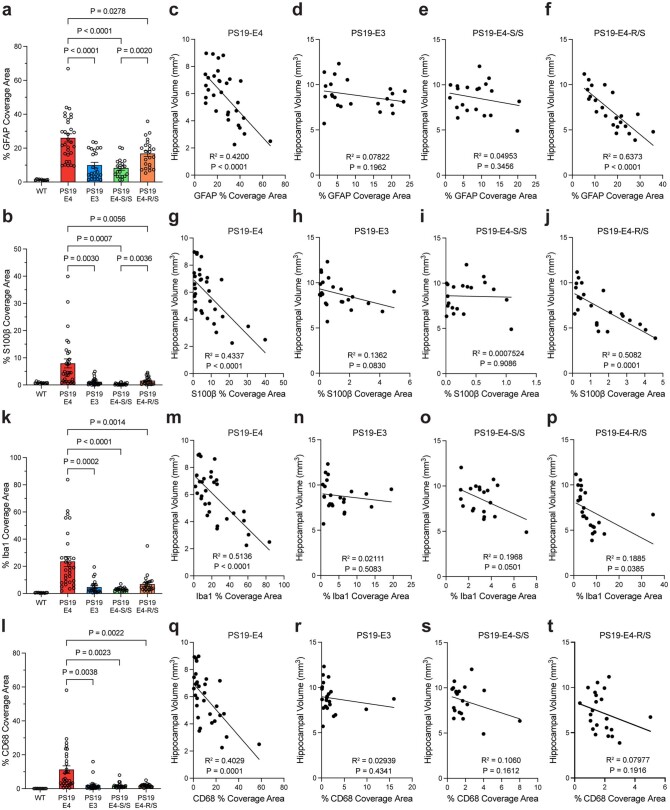
Extended Data Fig. 5. Quantifications and correlations between % coverage area of glial markers and hippocampal volume in tauopathy mice.
a,b, Quantification of % GFAP (a) or % S100β (b) coverage area in hippocampus of 10-month-old PS19-E4, PS19-E3, PS19-E4-S/S, and PS19-E4-R/S mice. c–f, Correlation between % GFAP coverage area and hippocampal volume in PS19-E4 (n = 31) (c), PS19-E3 (n = 23) (d), PS19-E4-S/S (n = 20) (e), and PS19-E4-R/S (n = 23) (f) mice at 10 months of age. g–j, Correlation between % S100β coverage area and hippocampal volume in PS19-E4 (n = 31) (g), PS19-E3 (n = 23) (h), PS19-E4-S/S (n = 20) (i), and PS19-E4-R/S (n = 23) (j) mice at 10 months of age. k,l, Quantification of % Iba1 (k) or % CD68 (l) coverage area in hippocampus of 10-month-old PS19-E4, PS19-E3, PS19-E4-S/S, and PS19-E4-R/S mice. m–p, Correlation between % Iba1 coverage area and hippocampal volume in PS19-E4 (n = 31) (m), PS19-E3 (n = 23) (n), PS19-E4-S/S (n = 20) (o), and PS19-E4-R/S (n = 23) (p) mice at 10 months of age. q–t, Correlation between % CD68 coverage area and hippocampal volume in PS19-E4 (n = 31) (q), PS19-E3 (n = 23) (r), PS19-E4-S/S (n = 20) (s), and PS19-E4-R/S (n = 23) (t) mice at 10 months of age. For all quantifications in a,b,k,l, WT, n = 11; PS19-E4, n = 31; PS19-E3, n = 24; PS19-E4-S/S, n = 21; PS19-E4-R/S, n = 23. In a,b,k,l, data are expressed as mean ± s.e.m. and differences between groups were determined by Welch’s ANOVA followed with Dunnett T3 multiple comparison test; comparisons of p ≤ 0.05 were labeled on graph. Pearson’s correlation analysis (two-sided).

