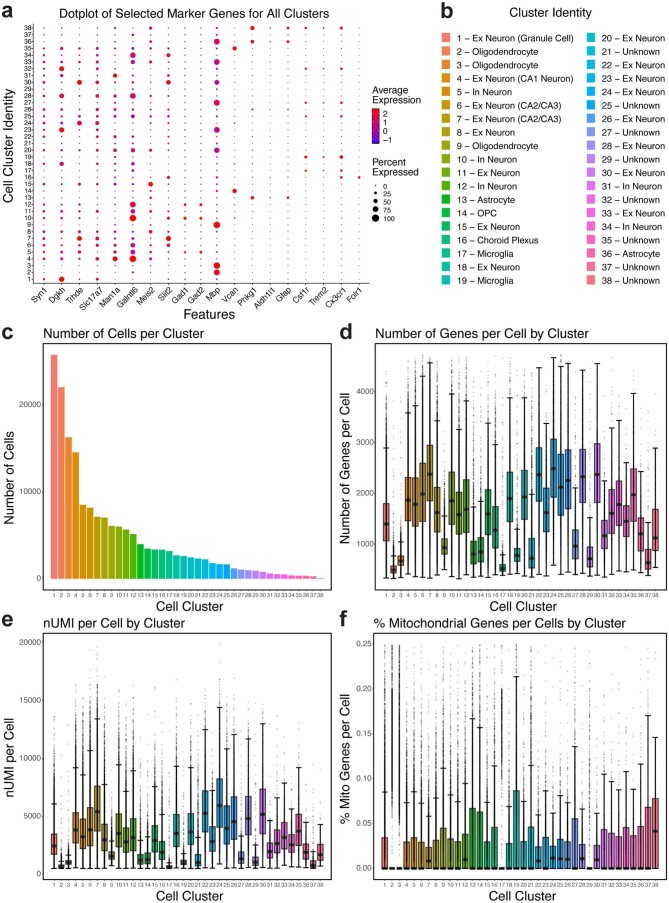
Extended Data Fig. 6. Quality control measures in snRNA-seq analysis of tauopathy mice with different APOE genotypes.
a, Dot-plot depicting normalized average expression of selected cell identity marker genes for all 38 distinct hippocampal cell clusters from mice at 10 months of age. b, Cluster identity of 38 distinct cell types. c, The number of cells per cluster. d, The number of genes per cell in each cluster (± s.e.m). e, The number of nUMI (unique molecular identified) per cell in each cluster (± s.e.m). f, The % mitochondrial genes per cell in each cluster (± s.e.m). Number of cells (n) for each cell cluster can be found in c. For details of the analyses, see Methods.

