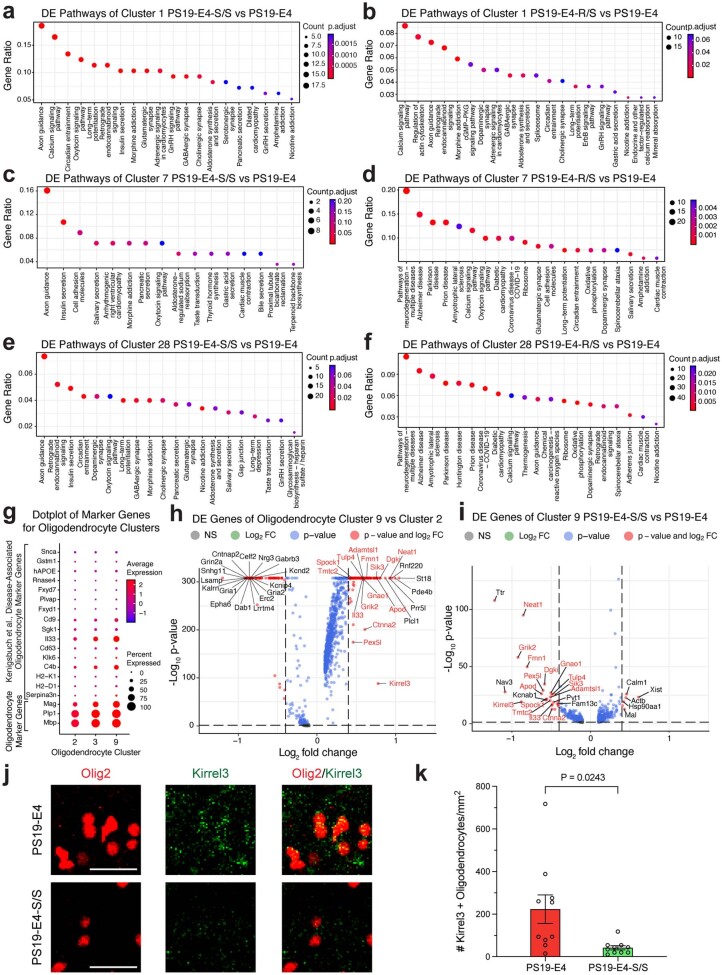
Extended Data Fig. 7. snRNA-seq analysis of disease-protective neuronal clusters and disease-associated oligodendrocyte cluster.
a,b, KEGG pathway enrichment dot-plot of top 20 pathways significantly enriched for DE genes of neuronal cluster 1 in PS19-E4-S/S (a) or PS19-E4-R/S (b) versus PS19-E4 mice at 10 months of age. c,d, KEGG pathway enrichment dot-plot of top 20 pathways significantly enriched for DE genes of neuronal cluster 7 in PS19-E4-S/S (c) or PS19-E4-R/S (d) versus PS19-E4 mice at 10 months of age. e,f, KEGG pathway enrichment dot-plot of top 20 pathways significantly enriched for DE genes of neuronal cluster 28 in PS19-E4-S/S (e) or PS19-E4-R/S (f) versus PS19-E4 mice at 10 months of age. g, Dot-plot normalized average expression of selected homeostatic and disease-associated oligodendrocyte (DAO) marker genes for oligodendrocyte clusters 2, 3, and 9. h, Volcano plot for top DE genes of oligodendrocyte cluster 9 versus cluster 2. i, Volcano plot for top DE genes of oligodendrocyte cluster 9 in PS19-E4-S/S versus PS19-E4 mice at 10 months of age. j, Representative images of Kirrel3+ Olig2+ oligodendrocytes in the hippocampus of 10-month-old PS19-E4 and PS19-E4-S/S mice at 10 months of age. Scale bars are 25 µm. k, Quantification of the number of Kirrel3+ Olig2+ oligodendrocytes (per mm2) within the dentate gyrus of hippocampus in 10-month-old PS19-E4 (n = 10) and PS19-E4-S/S (n = 10) mice at 10 months of age. In a–f, P-values are based on a two-sided hypergeometric test and are adjusted for multiple testing using the Benjamini-Hochberg method. Gene ratio represents the proportion of genes in the respective gene set that are deemed to be differentially expressed using the two-sided Wilcoxon Rank-Sum test as implemented in the FindMarkers function in Seurat. In h,i, horizonal dashed line indicates p-value = 0.05 and vertical dashed lines indicate log2 fold change = 0.4. All error bars represent s.e.m. Difference between groups in k was determined by unpaired, two-sided Welch’s t-test. DE, differentially expressed; NS, nonsignificant; FC, fold change. For details of the analyses, see Methods.

