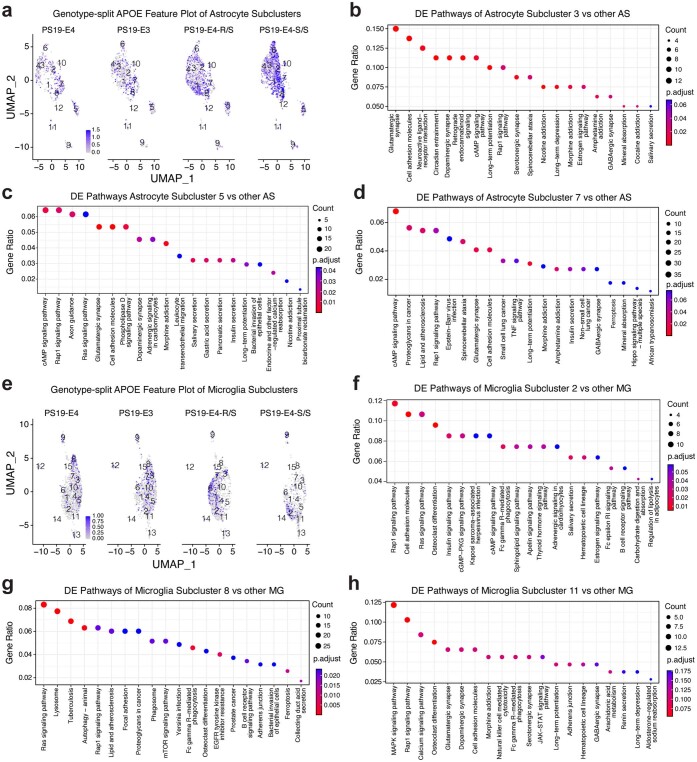
Extended Data Fig. 8. snRNA-seq analysis of astrocyte and microglia subclusters.
a, Feature plot showing relative levels of normalized human APOE gene expression across all 12 astrocyte subclusters by APOE genotype from mice at 10 months of age. b–d, KEGG pathway enrichment dot-plot of top 20 pathways significantly enriched for DE genes of astrocyte subclusters 3 (b), 5 (c), and 7 (d) versus other astrocyte subclusters. e, Feature plot showing relative levels of normalized human APOE gene expression across all 15 microglia subclusters by APOE genotype from mice at 10 months of age. f–h, KEGG pathway enrichment dot-plot of top 20 pathways significantly enriched for DE genes of microglia subclusters 2 (f), 8 (g), and 11 (h) versus other microglia subclusters. In b–d and f–h, P-values are based on a two-sided hypergeometric test and are adjusted for multiple testing using the Benjamini-Hochberg method. Gene Ratio represents the proportion of genes in the respective gene set that are deemed to be differentially expressed using the two-sided Wilcoxon Rank-Sum test as implemented in the FindMarkers function in Seurat.

