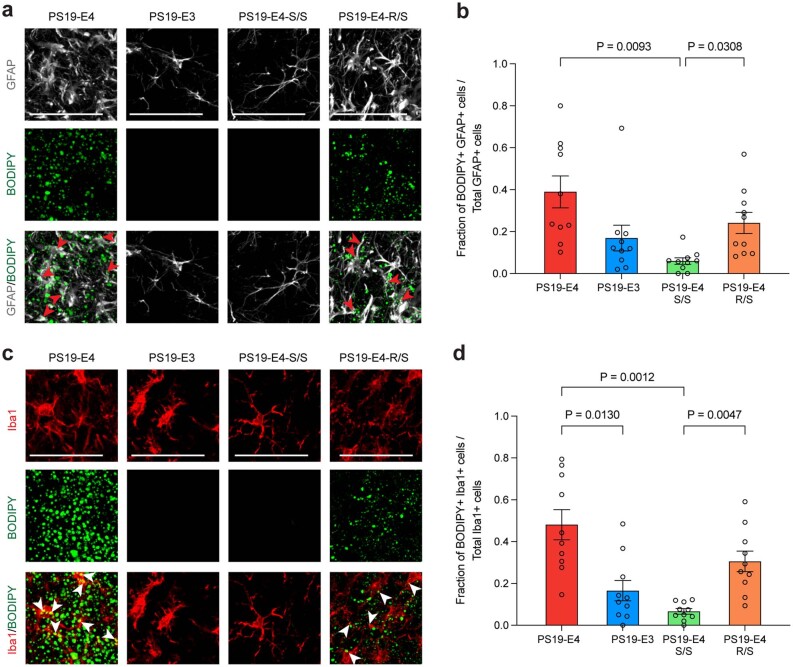
Extended Data Fig. 9. The R136S mutation reduces APOE4-induced neutral lipid accumulation in astrocytes and microglia in tauopathy mice.
a, Representative images of neutral lipid visualized with BODIPY staining in GFAP+ astrocytes in the dentate gyrus of hippocampus in PS19-E4, PS19-E3, PS19-E4-S/S, and PS19-E4-R/S mice at 10 months of age (example overlap shown in red arrows). b, Quantification of the fraction of BODIPY+ GFAP+ cells per total GFAP+ cells in the dentate gyrus of hippocampus in PS19-E4, PS19-E3, PS19-E4-S/S, and PS19-E4-R/S mice at 10 months of age. c, Representative images of neutral lipid visualized with BODIPY staining in Iba1+ microglia in the dentate gyrus of hippocampus in PS19-E4, PS19-E3, PS19-E4-S/S, and PS19-E4-R/S mice at 10 months of age (example overlap shown in white arrows). d, Quantification of the fraction of BODIPY+ Iba1+ cells per total Iba1+ cells in the dentate gyrus of hippocampus in PS19-E4, PS19-E3, PS19-E4-S/S, and PS19-E4-R/S mice at 10 months of age. In a and c, scale bars are 50 µm. In b and d, PS19-E4, n = 10; PS19-E3, n = 10; PS19-E4-S/S, n = 10; PS19-E4-R/S, n = 10; n=mice. In b,d, data are expressed as mean ± s.e.m. and differences between groups were determined by Welch’s ANOVA followed with Dunnett T3 multiple comparison test; comparisons of p ≤ 0.05 were labeled on graph. DE, differentially expressed; AS, astrocyte; MG, microglia. For details of the analyses, see Methods.

