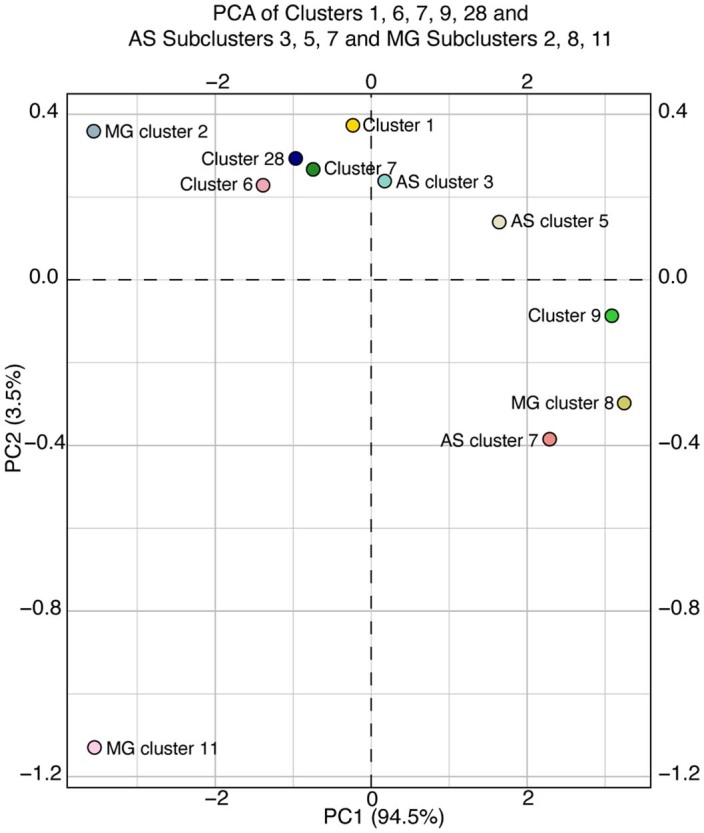
Extended Data Fig. 10. PCA clustering of selected hippocampal cell clusters as well as astrocyte and microglia subclusters against all measured pathologies.

Principal component analysis plot for hippocampal clusters 1, 6, 7, 9, 28, astrocyte subclusters 3, 5, 7, and microglia subclusters 2, 8, 11 against all measured pathologies (hippocampal volume and coverage areas of AT8, Iba1, CD68, GFAP, and S100β). PC1 and PC2 showed the overall relationship between clusters based on similarity of the estimated log odds ratio per unit change in six pathologies per cluster/subcluster. AS, astrocyte; MG, microglia. For details of the analyses, see Methods.
