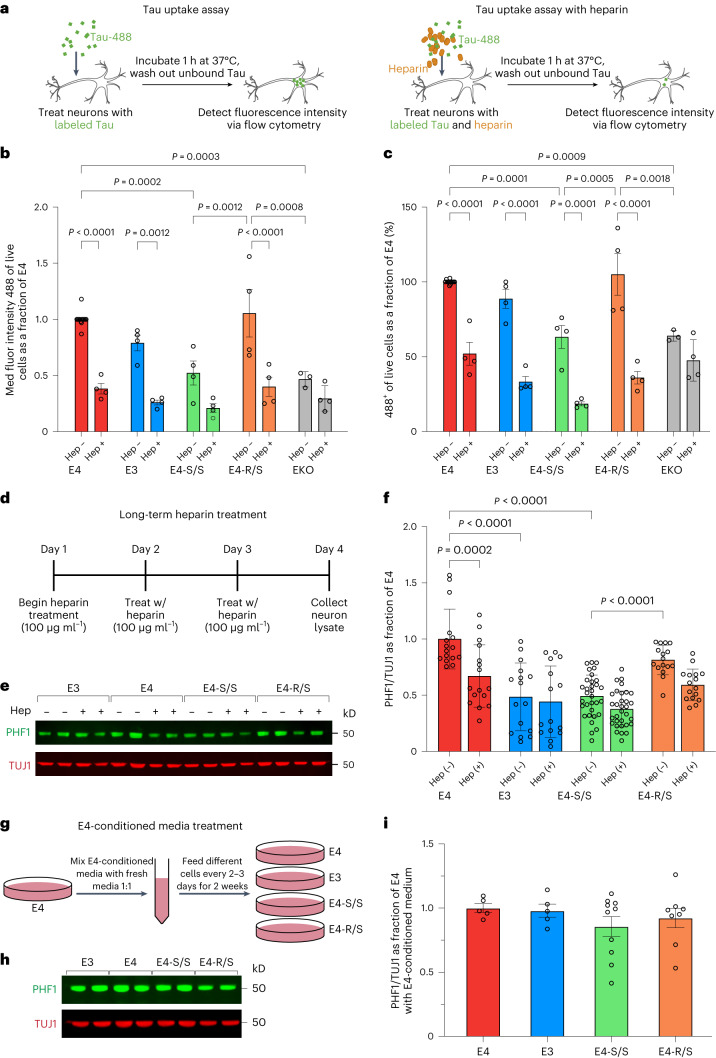
Fig. 3. Homozygous R136S mutation protects against APOE4-induced p-Tau accumulation by reducing Tau uptake via the HSPG pathway.
a, Diagram of Tau-488 uptake assay. Neurons treated with either Tau-488 alone (left) or Tau-488 together with 100 µg ml−1 heparin (right) before flow cytometry analysis. b, Measurement of individual neuronal Tau-488 uptake (25 nM, 1-h incubation) based on MFI per cell in human neurons. c, Measurement of Tau-488 uptake (25 nM, 1-h incubation) based on percent Tau-488+ human neurons. In b,c, n = independent experiments and normalized to E4 MFI (b) or uptake (%) (c). E4, n = 13; E4+heparin, n = 4; E3, n = 4; E3+heparin, n = 4; E4-S/S, n = 4; E4-S/S+heparin, n = 4; E4-R/S, n = 4; E4-R/S+heparin, n = 4; EKO, n = 3; EKO+heparin, n = 4. Analysis was performed on a live cell population of estimated 5,000 cells for each sample. d, Experimental design for long-term heparin treatment of human neurons. e,f, Representative western blot images (e) and quantification of PHF1+ p-Tau levels (f) in lysates of E4, E3, E4-S/S or E4-R/S neurons under long-term heparin treatment. In f, PHF1+ p-Tau levels were normalized to those of E4. TUJ1 was used as loading control (E4, n = 16; E4+heparin, n = 16; E3, n = 16; E3+heparin, n = 15; E4-S/S, n = 32; E4-S/S+heparin, n = 32; E4-R/S, n = 16; E4-R/S+heparin, n = 16). g, Experimental design for E4 neuron-conditioned medium treatment of human neurons with different APOE genotypes. h,i, Representative western blot images (h) and quantification of PHF1+ p-Tau levels (i) in lysates of E4, E3, E4-S/S or E4-R/S neurons after E4 neuron-conditioned medium treatment. In i, PHF1+ p-Tau levels were normalized to those of E4. TUJ1 was used as loading control (E4, n = 5; E3, n = 5; E4-S/S, n = 10; E4-R/S, n = 10). In f,i, n =biological replicates. Throughout, data are expressed as mean ± s.e.m. Differences between groups were determined by two-way ANOVA followed by Tukey’s multiple comparison test (b,c,f) or ordinary one-way ANOVA followed by Tukey’s multiple comparison test (i). Some comparisons of P ≤ 0.05 are labeled on the graph. Hep, heparin; fluor, fluorescence.

