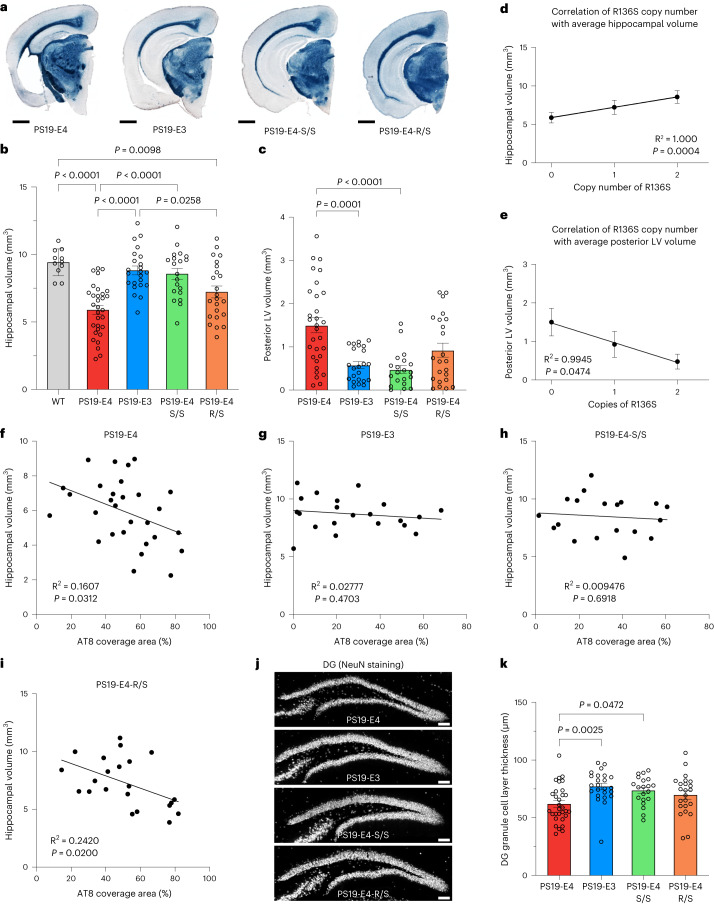
Fig. 4. The R136S mutation ameliorates APOE4-driven neurodegeneration in tauopathy mice.
a, Representative images of 10-month-old PS19-E4, PS19-E3, PS19-E4-S/S and PS19-E4-R/S mouse brain sections stained with Sudan black to enhance hippocampal visualization (scale bar, 1 mm). b,c, Quantification of hippocampal volume (WT, n = 11; PS19-E4, n = 31; PS19-E3, n = 23; PS19-E4-S/S, n = 20; PS19-E4-R/S, n = 23; n = mice) (b) and posterior lateral ventricle volume (PS19-E4, n = 30; PS19-E3, n = 23; PS19-E4-S/S, n = 20; PS19-E4-R/S, n = 23; n = mice) (c). d,e, Correlation of the APOE4-R136S gene copy number with the average of hippocampal volume (PS19-E4, n = 31; PS19-E4-S/S, n = 20; PS19-E4-R/S, n = 23; n = mice) (d) or the average of posterior lateral ventricle volume (PS19-E4, n = 30; PS19-E4-S/S, n = 20; PS19-E4-R/S, n = 23; n = mice) (e) in PS19-E4 mice with 0, 1 or 2 copies of the APOE4-R136S gene mutation. f–i, Correlations between percent AT8 coverage area and hippocampal volume in 10-month-old PS19-E4 (n = 29) (f), PS19-E3 (n = 21) (g), PS19-E4-S/S (n = 19) (h) and PS19-E4-R/S (n = 22) (i) mice. j, Representative images of the DG stained for NeuN in 10-month-old PS19-E4, PS19-E3, PS19-E4-S/S and PS19-E4-R/S mice (scale bar, 100 μm). k, Quantification of DG GC layer thickness in 10-month-old PS19-E4 (n = 30), PS19-E3 (n = 23), PS19-E4-S/S (n = 20) and PS19-E4-R/S (n = 23) mice. Throughout, data are expressed as mean ± s.e.m. except for correlation plots. Differences between groups were determined by ordinary one-way ANOVA followed by Tukey’s multiple comparison test (b,k) or Welch’s ANOVA followed by Dunnett’s T3 multiple comparison test (c). Comparisons of P ≤ 0.05 are labeled on the graph. Pearson’s correlation analysis (two-sided). LV, lateral ventricle.

