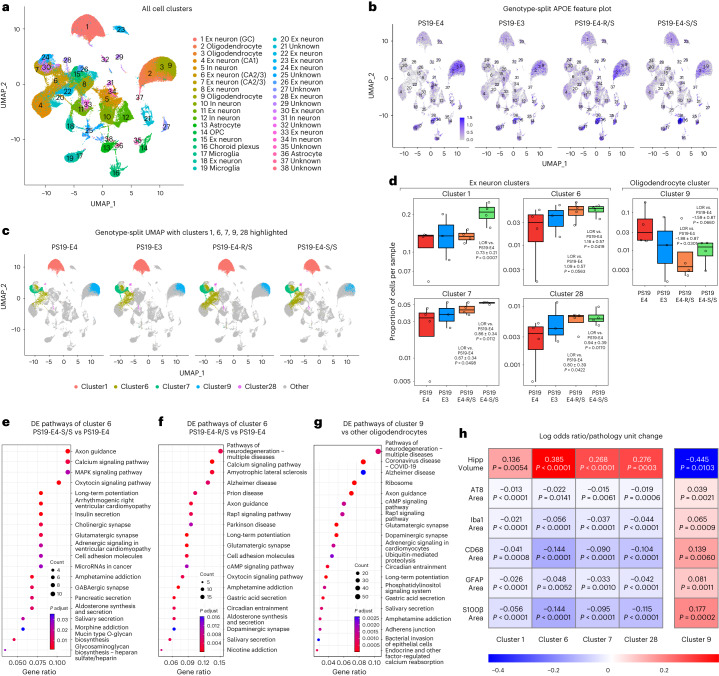
Fig. 6. snRNA-seq reveals protective effects of the R136S mutation on APOE4-driven neuronal and oligodendrocytic deficits in mice.
a, UMAP projection of 38 distinct cell clusters in hippocampi of 10-month-old PS19-E4 (n = 4), PS19-E3 (n = 3), PS19-E4-S/S (n = 4) and PS19-E4-R/S (n = 4) mice. b, Feature plot showing relative levels of normalized human APOE gene expression across all 38 hippocampal cell clusters by APOE genotype (PS19-E4, n = 4; PS19-E3, n = 3; PS19-E4-S/S, n = 4; PS19-E4-R/S, n = 4; n = mice). c, UMAP projection highlighting hippocampal cell clusters 1, 6, 7, 9 and 28 for each genotype group. d, Box plot of the proportion of cells from each sample in clusters 1, 6, 7, 9 and 28 in PS19-E4 (n = 4), PS19-E3 (n = 3), PS19-E4-R/S (n = 4), and PS19-E4-S/S (n = 4) mice. The lower, middle and upper hinges of the box plots correspond to the 25th, 50th and 75th percentiles, respectively. The upper whisker of the box plot extends from the upper hinge to the largest value no further than 1.5 Å~ IQR from the upper hinge. IQR, interquartile range, or distance between the 25th and 75th percentiles. The lower whisker extends from the lower hinge to the smallest value at most 1.5 Å~ IQR from the lower hinge. The LORs are the mean ± s.e.m. estimates of LOR for these clusters, which represents the change in the log odds of cells per sample from PS19-E3, PS19-E4-R/S or PS19-E4-S/S mice belonging to the respective clusters compared to the log odds of cells per sample from PS19-E4 mice. e,f, KEGG pathway enrichment dot plot of top 20 pathways significantly enriched for DE genes of neuronal cluster 6 in PS19-E4-S/S (e) or PS19-E4-R/S (f) versus PS19-E4 mice. P values are based on a two-sided hypergeometric test and are adjusted for multiple testing using the Benjamini–Hochberg method. Gene ratio represents the proportion of genes in the respective gene set that are deemed to be DE using the two-sided Wilcoxon rank-sum test as implemented in the FindMarkers function in Seurat. g, KEGG pathway enrichment dot plot of top 20 pathways significantly enriched for DE genes of oligodendrocyte cluster 9 versus oligodendrocyte cluster 2. h, Heat map plot of LOR per unit change in each pathological measurement for clusters 1, 6, 7, 9 and 28. The LOR represents the mean estimate of the change in the log odds of cells per sample from a given animal model, corresponding to a unit change in a given histopathological parameter. Associations with pathologies are colored (negative associations, blue; positive associations, red). P values in d are from fits to a GLMM_AM, and P values in h are from fits to a GLMM_histopathology; the associated tests are two-sided. All error bars represent s.e.m. Ex neuron, excitatory neuron; In neuron, inhibitory neuron.

