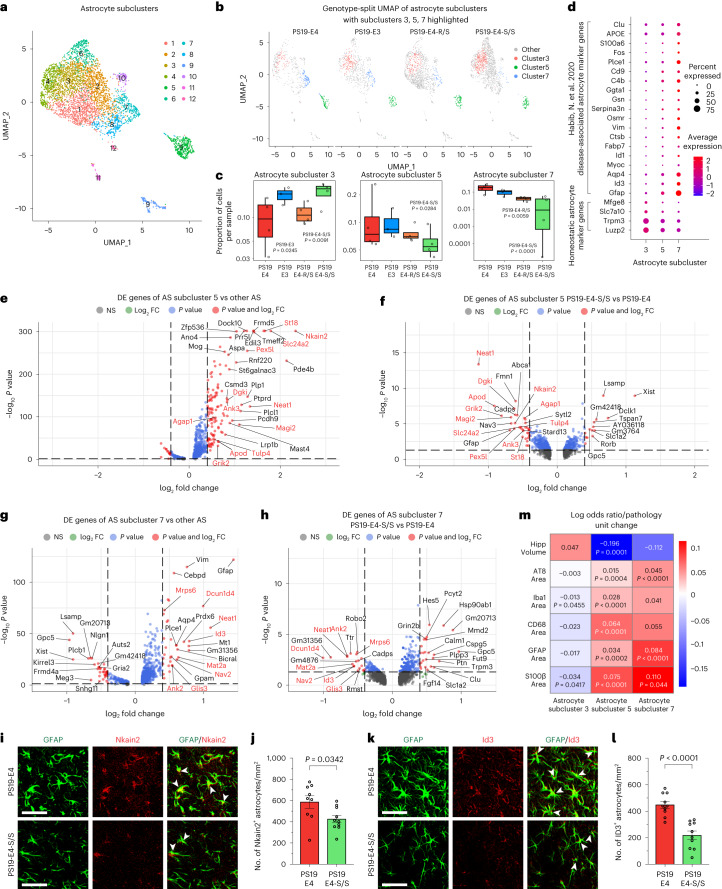
Fig. 7. The APOE4-R136S mutation increases disease-protective and decreases disease-associated astrocyte subpopulations.
a, UMAP projection of 12 astrocyte subclusters after subclustering hippocampal cell clusters 13 and 36 (Fig. 6a) from 10-month-old mice with different APOE genotypes. b, UMAP projection highlighting astrocyte subclusters 3, 5 and 7 for each genotype group (PS19-E4, n = 4; PS19-E3, n = 3; PS19-E4-S/S, n = 4; PS19-E4-R/S, n = 4; n = mice). c, Box plot of the proportion of cells from each sample in astrocyte subclusters 3, 5 and 7 in PS19-E4 (n = 4), PS19-E3 (n = 3), PS19-E4-R/S (n = 4), and PS19-E4-S/S (n = 4) mice. The lower, middle and upper hinges of the box plots correspond to the 25th, 50th and 75th percentiles, respectively (see Fig. 6d for details). The LORs are the mean ± s.e.m. estimates of LOR for these clusters, which represents the change in the log odds of cells per sample from PS19-E3, PS19-E4-R/S or PS19-E4-S/S mice belonging to the respective clusters compared to the log odds of cells per sample from PS19-E4 mice. LOR versus PS19-E4 for subcluster 3: PS19-E3, 0.67 ± 0.30; PS19-E4-S/S, 0.71 ± 0.27; subcluster 5: PS19-E4-S/S, −0.74 ± 0.34; subcluster 7: PS19-E4-R/S, −1.57 ± 0.57; PS19-E4-S/S, −2.75 ± 0.62. d, Dot plot of normalized average expression of selected homeostatic and DAA marker genes for astrocyte subclusters 3, 5 and 7. e, Volcano plot for top 30 DE genes of astrocyte subcluster 5 versus other astrocyte subclusters. f, Volcano plot for top 30 DE genes of astrocyte subcluster 5 in PS19-E4-S/S versus PS19-E4 mice. g, Volcano plot for top 30 DE genes of astrocyte subcluster 7 versus other astrocyte subclusters. h, Volcano plot for top 30 DE genes of astrocyte subcluster 7 in PS19-E4-S/S versus PS19-E4 mice. i, Representative images of Nkain2+GFAP+ astrocytes in the hippocampus of 10-month-old PS19-E4 (n = 9) and PS19-E4-S/S (n = 10) mice. j, Quantification of the number of Nkain2+GFAP+ cells (per mm2) within the molecular layer of hippocampus. k, Representative images of Id3+GFAP+ astrocytes in the hippocampus of 10-month-old PS19-E4 (n = 10) and PS19-E4-S/S (n = 10) mice. l, Quantification of the number of Id3+GFAP+ cells (per mm2) within the molecular layer of hippocampus. m, Heat map plot of LOR per unit change in each pathological measurement for astrocyte subclusters 3, 5 and 7. P values in c are from fits to a GLMM_AM, and P values in m are from fits to a GLMM_histopathology; the associated tests are two-sided. In e–h, horizonal dashed line indicates P = 0.05, and vertical dashed lines indicate log2 fold change = 0.4. The unadjusted P values and log2 fold change values used were generated from the gene set enrichment analysis using the two-sided Wilcoxon rank-sum test as implemented in the FindMarkers function of the Seurat package. Gene names highlighted in red text indicate that they are selected marker genes for DAAs. Scale bars in i and k, 50 µm. All error bars represent s.e.m. Differences between groups in j and l were determined by unpaired, two-sided Welch’s t-test. AS, astrocyte; NS, not significant; FC, fold change.

